Source page — copy text into Substack/LinkedIn, upload the visuals. noindex · not public

Closelook@Global Stock Markets · Weekly Edition
Global Markets — Brazil Jumps 14%, Korea Falls 8%, America Takes the Year Back
Brazil's fund jumped 14% after the first round of its election, and Latin America and China rose with it — while the chip markets that carried the quarter fell, Korea by 7.6 percent, as the AI trade moved from the companies that build it to the companies that sell it. Software rose, chips fell, and in America the average stock beat the Nasdaq. The world ex-US index closed the week three cents under its structural line, and for the first time this year America leads it for 2026. The dollar made another high close and the euro its lowest of the year; the ten-year real yield touched its highest since November 2008. TSMC's September sales passed the test this letter set for them — and the chip markets fell anyway.
Closelooknet is a reader-supported publication — to receive new posts and support the work, become a free or paid subscriber.
1 · This Week's Action
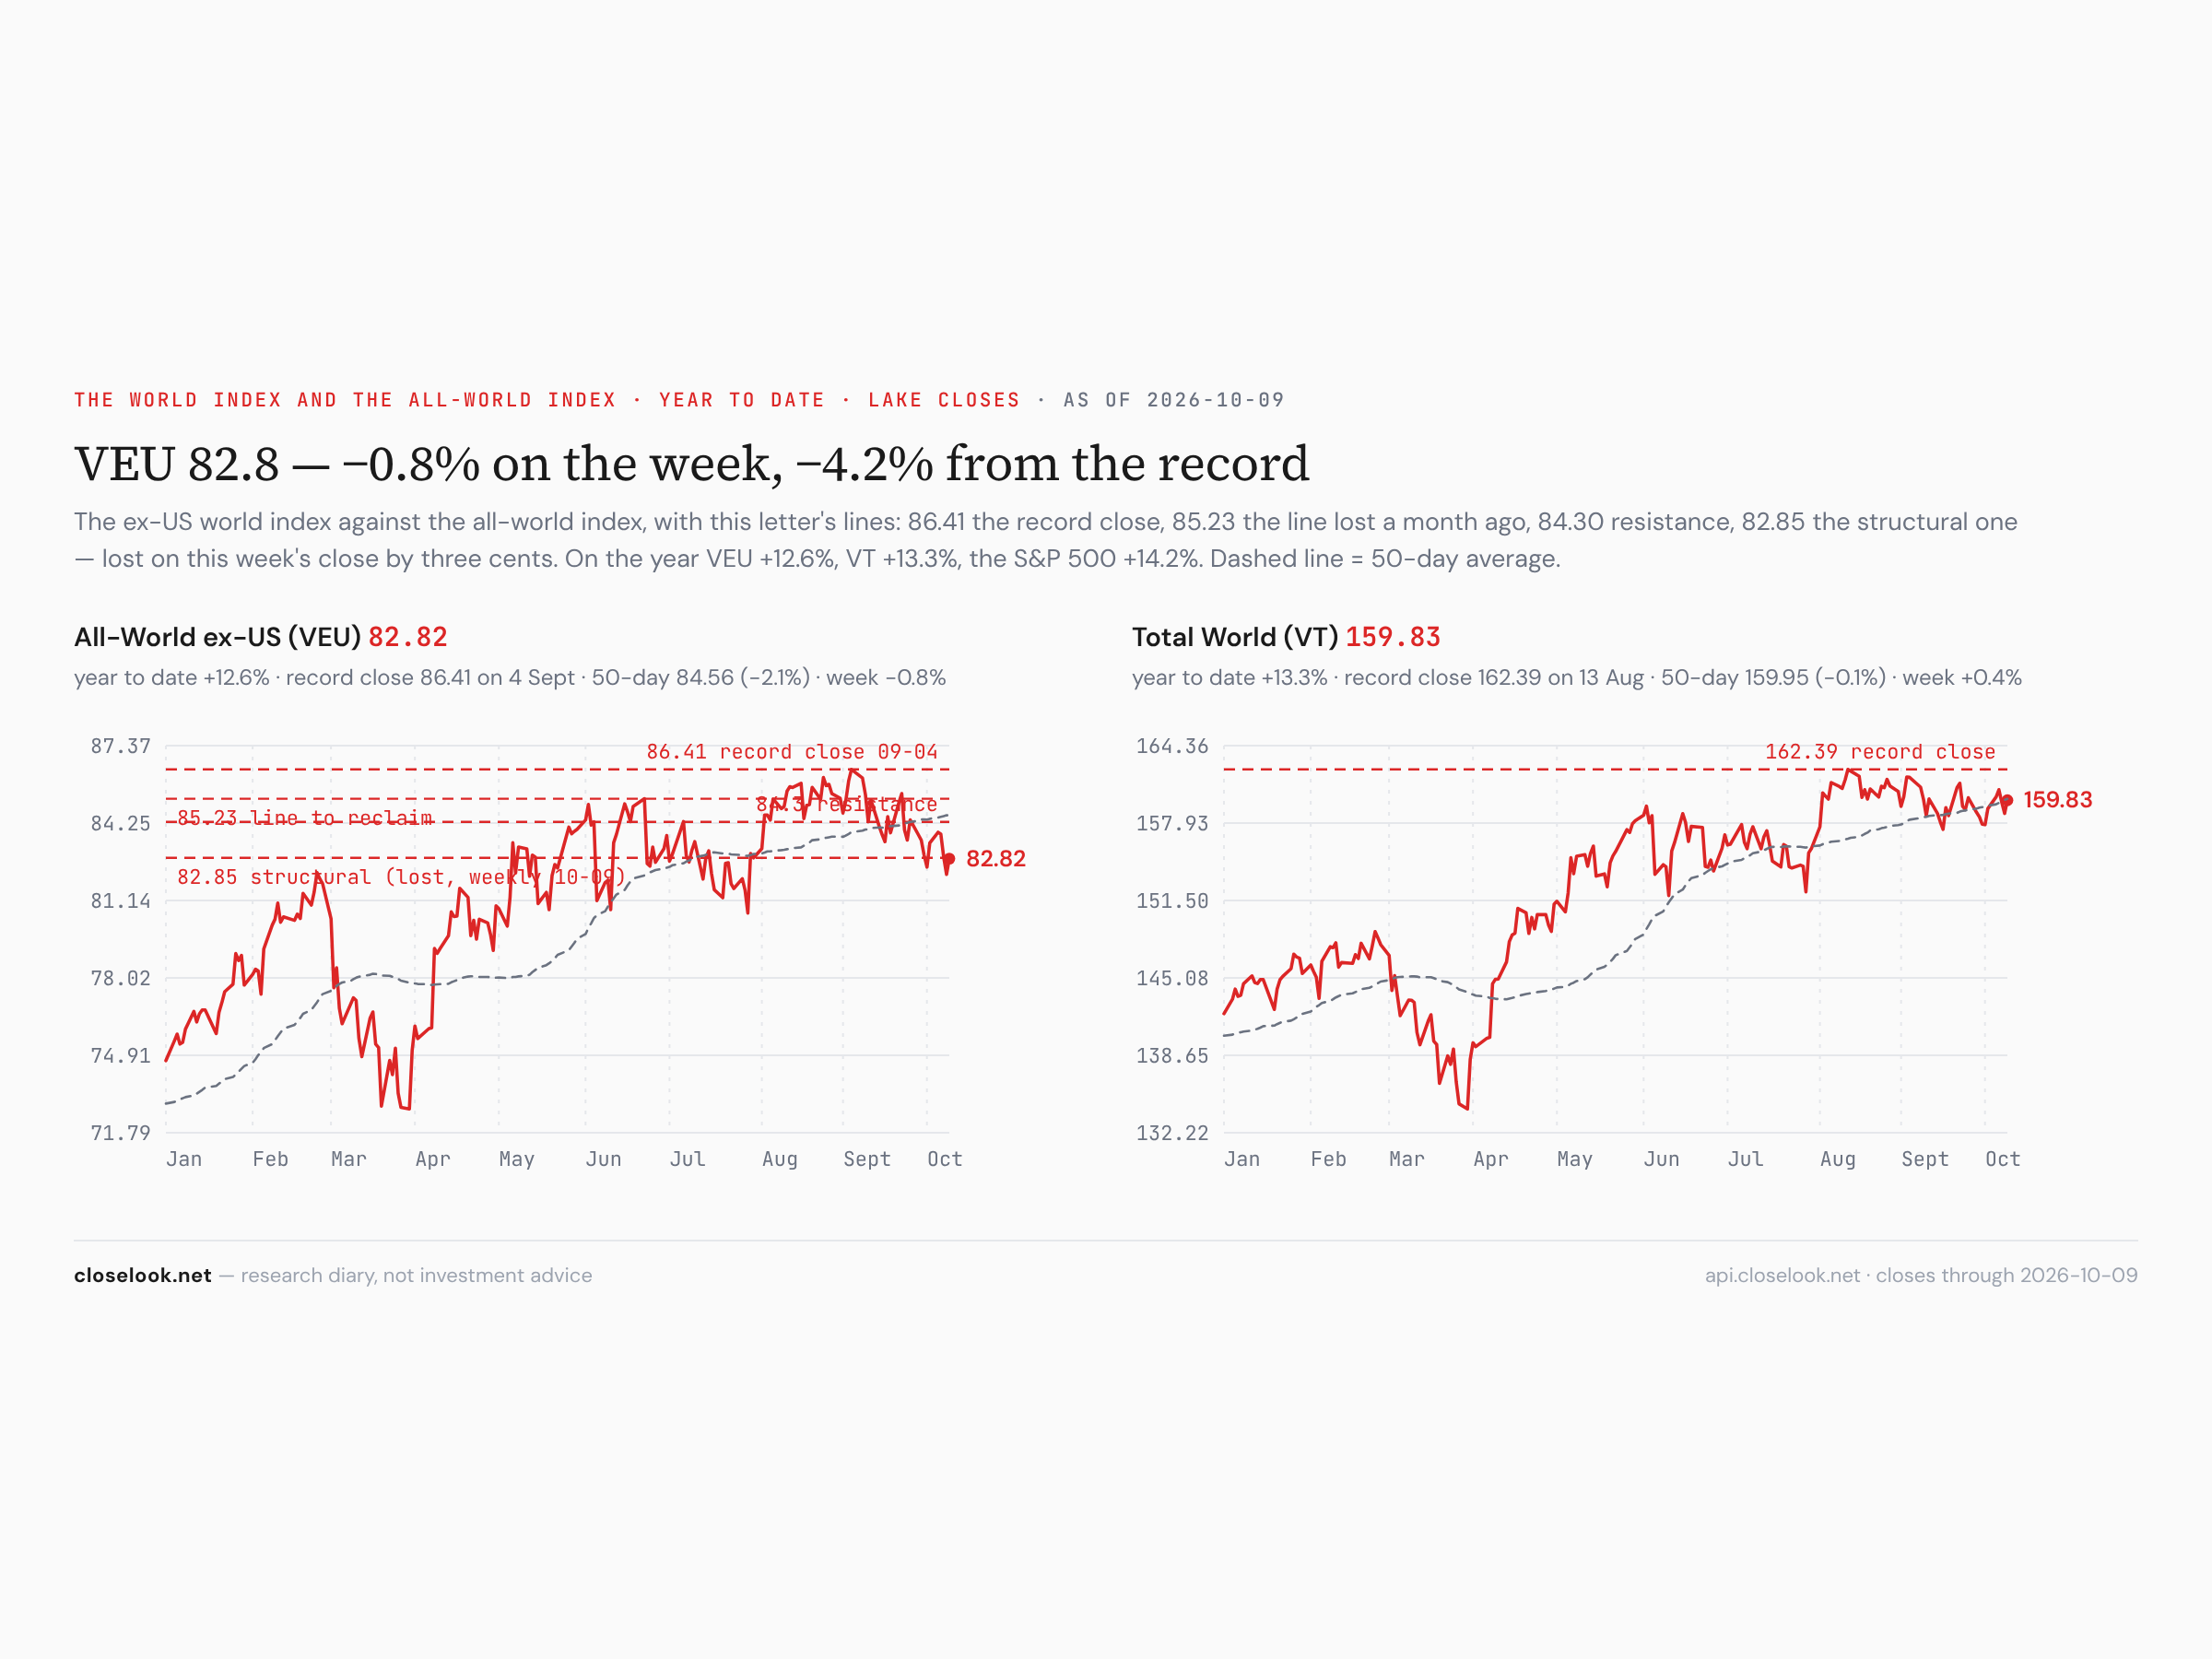
The global view. The ex-US world index closed the week at 82.82, down 0.75% — three cents under 82.85, the structural line this letter has carried since the summer, on a weekly close for the first time. The path: Monday 83.88, Tuesday 83.81, Wednesday 82.85 — on the line to the cent — Thursday 82.18, Friday 82.82. The index sits 4.2% under its September 4 record of 86.41. The all-world index rose 0.44% to 159.83. The S&P 500 fund rose 1.16% to 778.57, a record close on Tuesday at 779.09; the Nasdaq 100 fund rose only 0.23%.
The year changed hands. The S&P 500 fund is +14.2% for 2026, the all-world index +13.3%, the world ex-US +12.6%. A week ago the ex-US world led America for the year by six tenths of a point; it led by 4.5 points five weeks ago. This week America took the lead, by 1.6 points — the fifth stay-home week in a row, and the first in which the year's order reads America first. The house cointegration monitor still lists the VEU/SPY pair as breaking, the spread now 2.6 standard deviations below its mean.
Brazil — the vote that moved a market. The week's largest move on the board had nothing to do with chips. Brazil held the first round of its presidential election on Sunday: Flávio Bolsonaro took 47.0% of the valid votes against 45.2% for President Lula, and the two go to a runoff on 25 October. On Monday São Paulo's Ibovespa rose 7.7% to 206,912, its first close above 200,000, led by the banks; in New York the Brazil fund EWZ rose 12.5% on the day, and 14.0% on the week to 43.54 — its highest close in a year, +37% for 2026. Investors read the result as a vote for tighter public finances. The Latin America fund rose 9.1%, Argentina 4.8%, Mexico 1.2%. One country's election did not change the AI map, but it did something the map rarely shows: it moved money into a market that owns no part of the AI build-out at all.
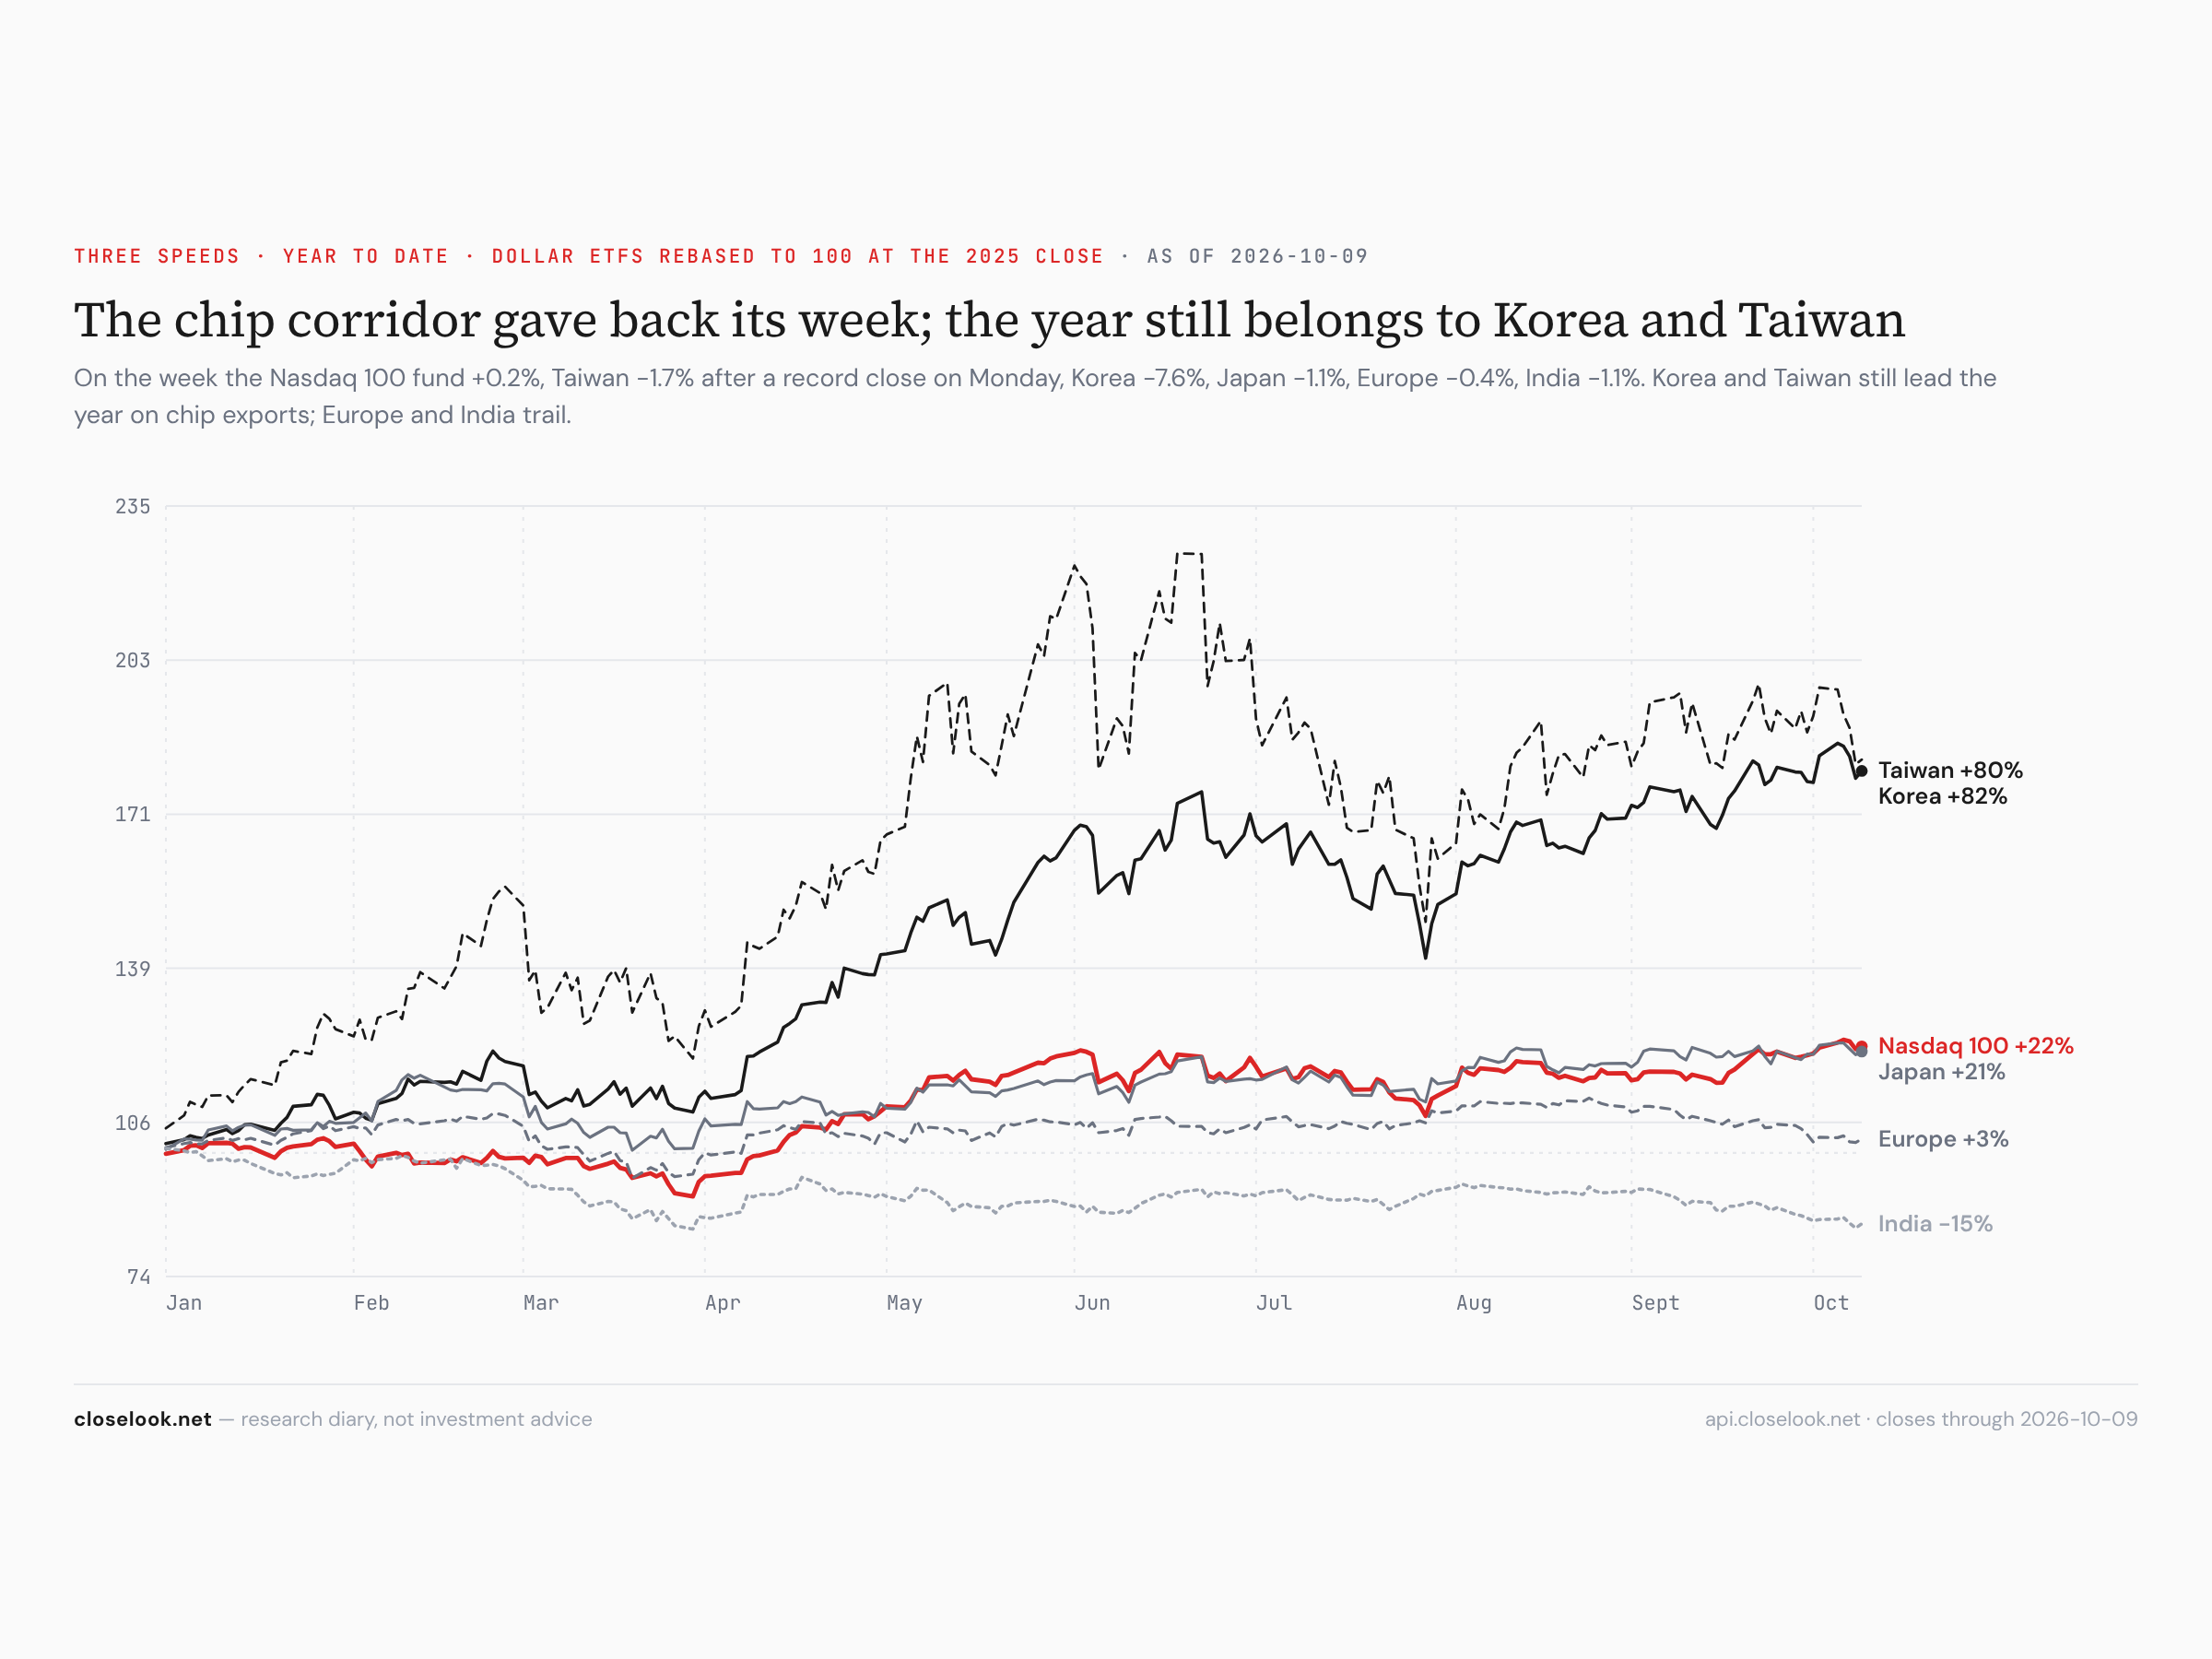
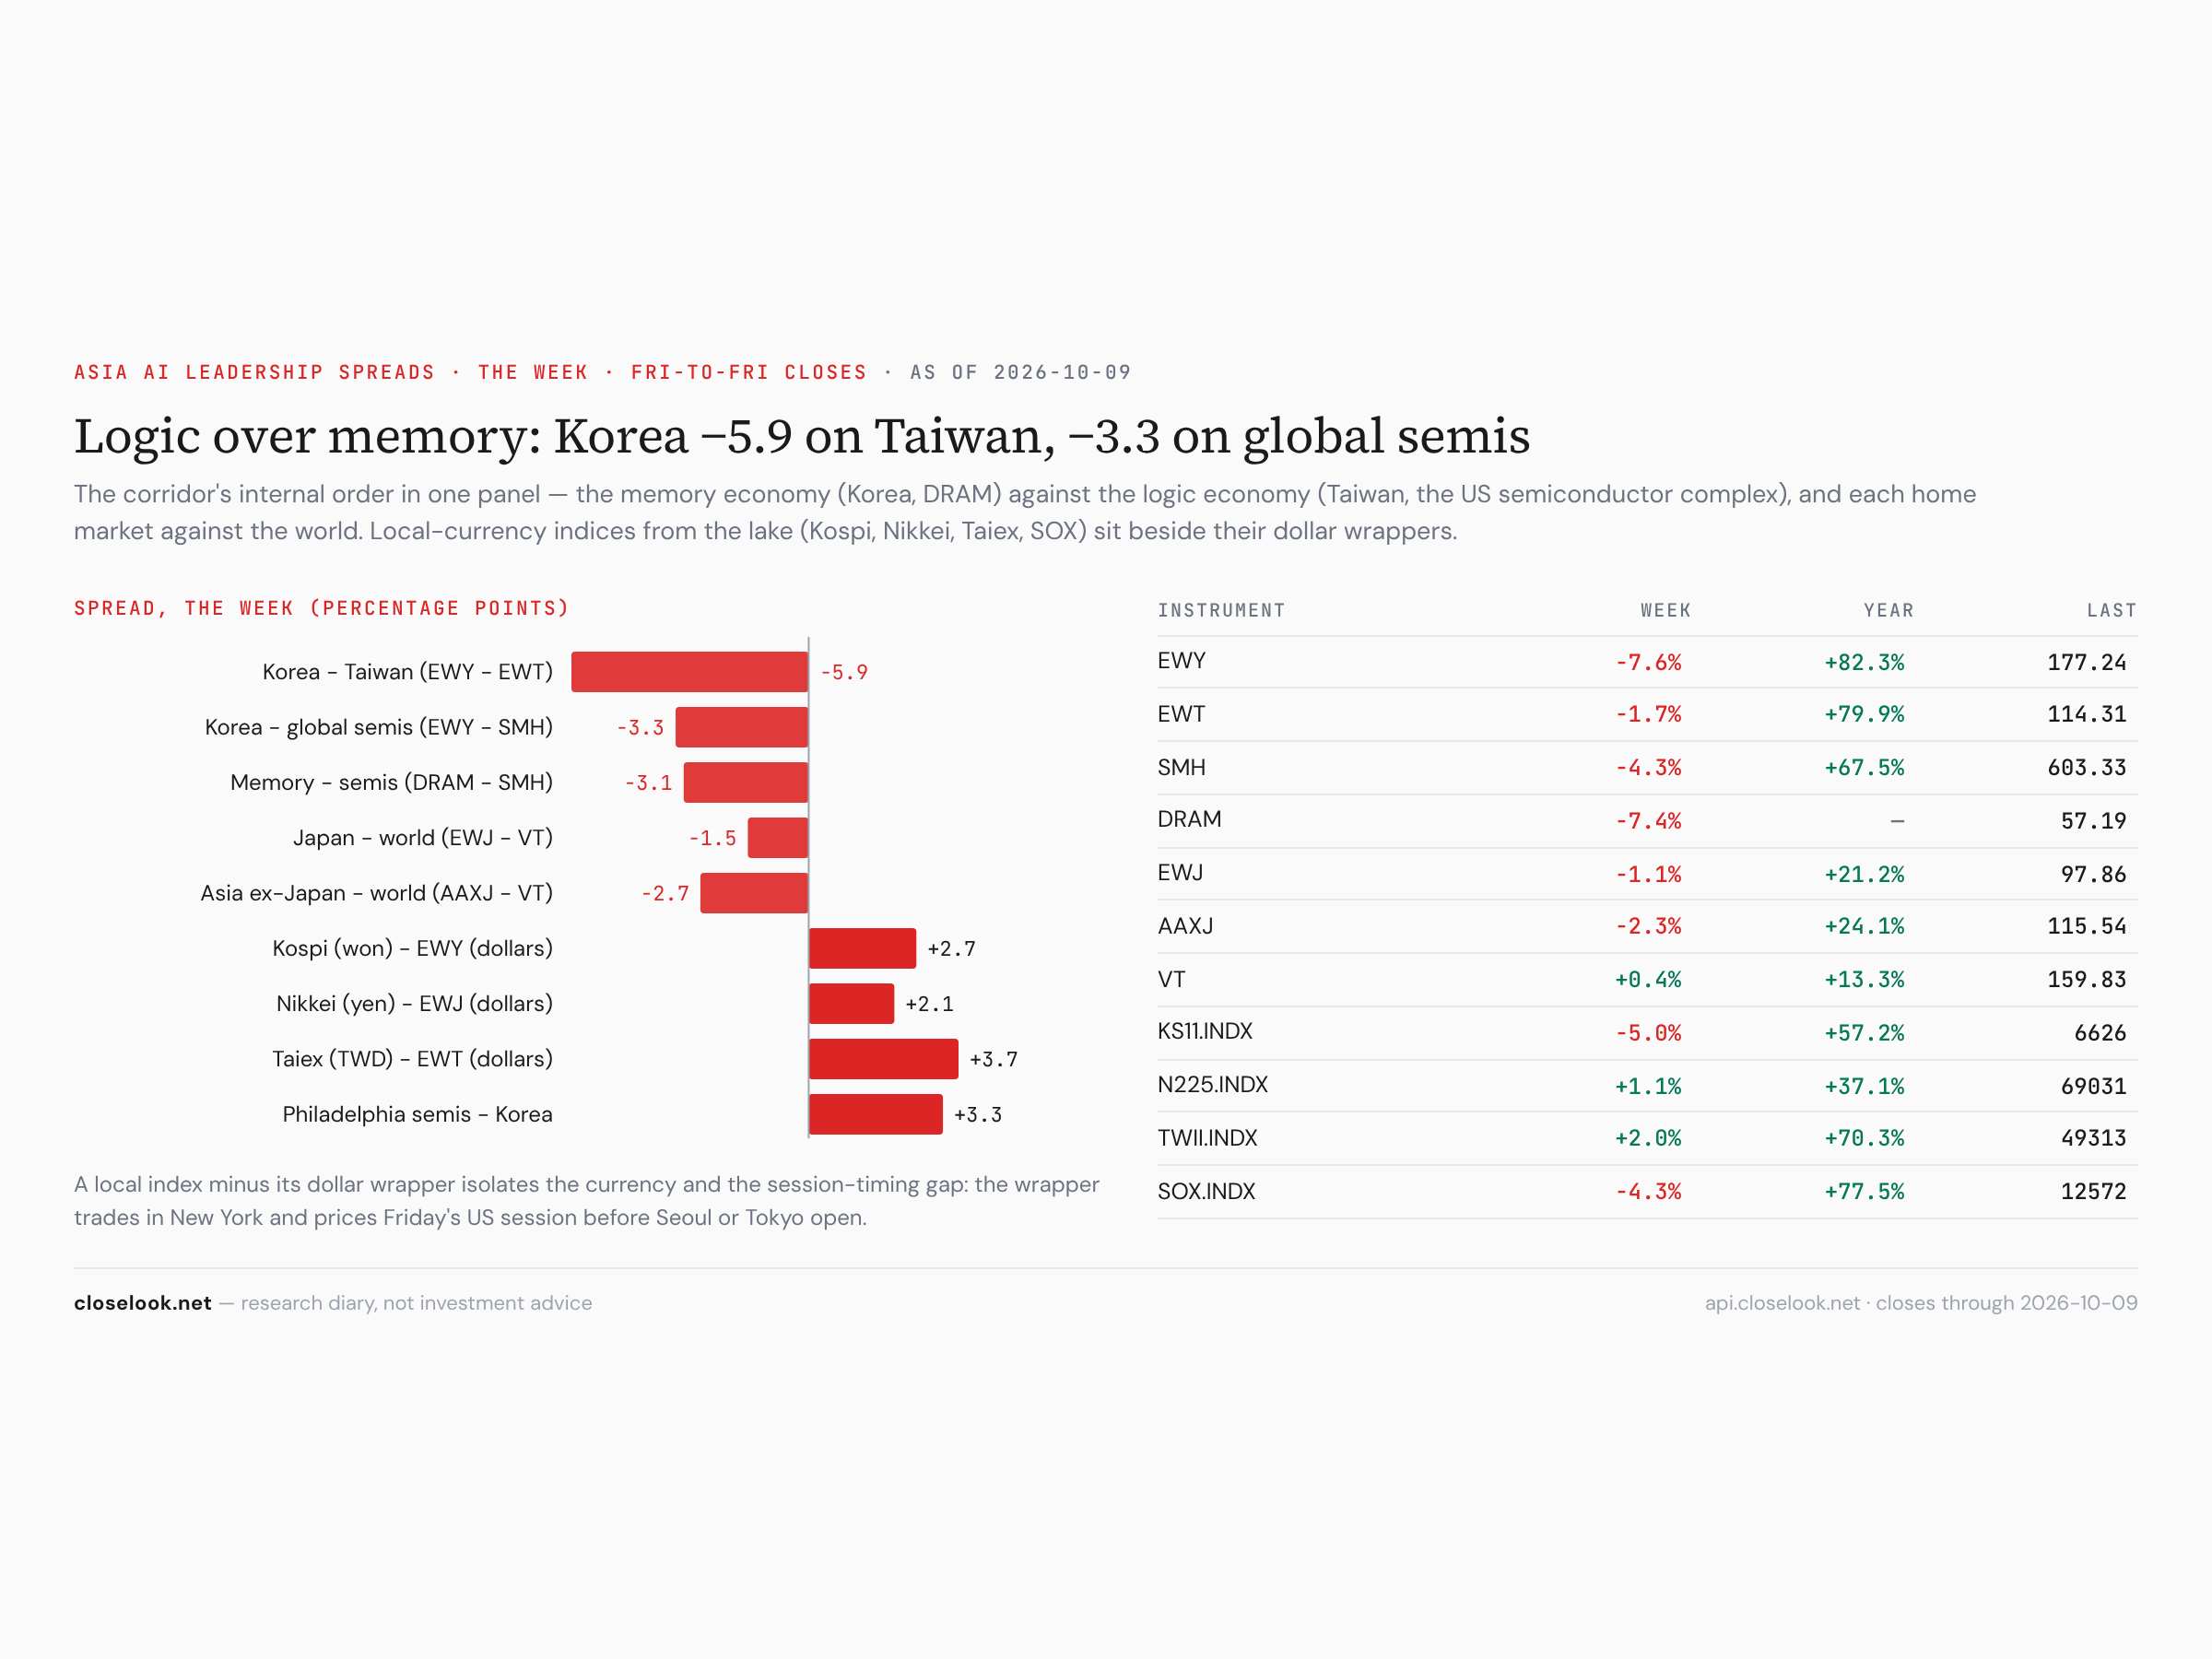
The chip corridor gave back its week. The other side of the board is the corridor that carried the quarter. Korea's fund fell 7.6% to 177.24; the Kospi lost 5.4% in its three sessions from Tuesday to Thursday — Seoul was shut on Monday and for Friday's Hangul Day holiday. Seoul sold its memory makers on Tuesday and Wednesday, and on Thursday the chip trade broke everywhere: a report put OpenAI's annual revenue nearer 50 billion dollars than 70 billion, and America's chip index fell 3.4% in a day. Taiwan's fund fell 1.7% to 114.31 — after a record close of 118.00 on Monday and a record Taiex of 49,823 on Tuesday — and Japan's fund 1.1%. Taipei was shut on Friday, so its week ends on Thursday's drop.
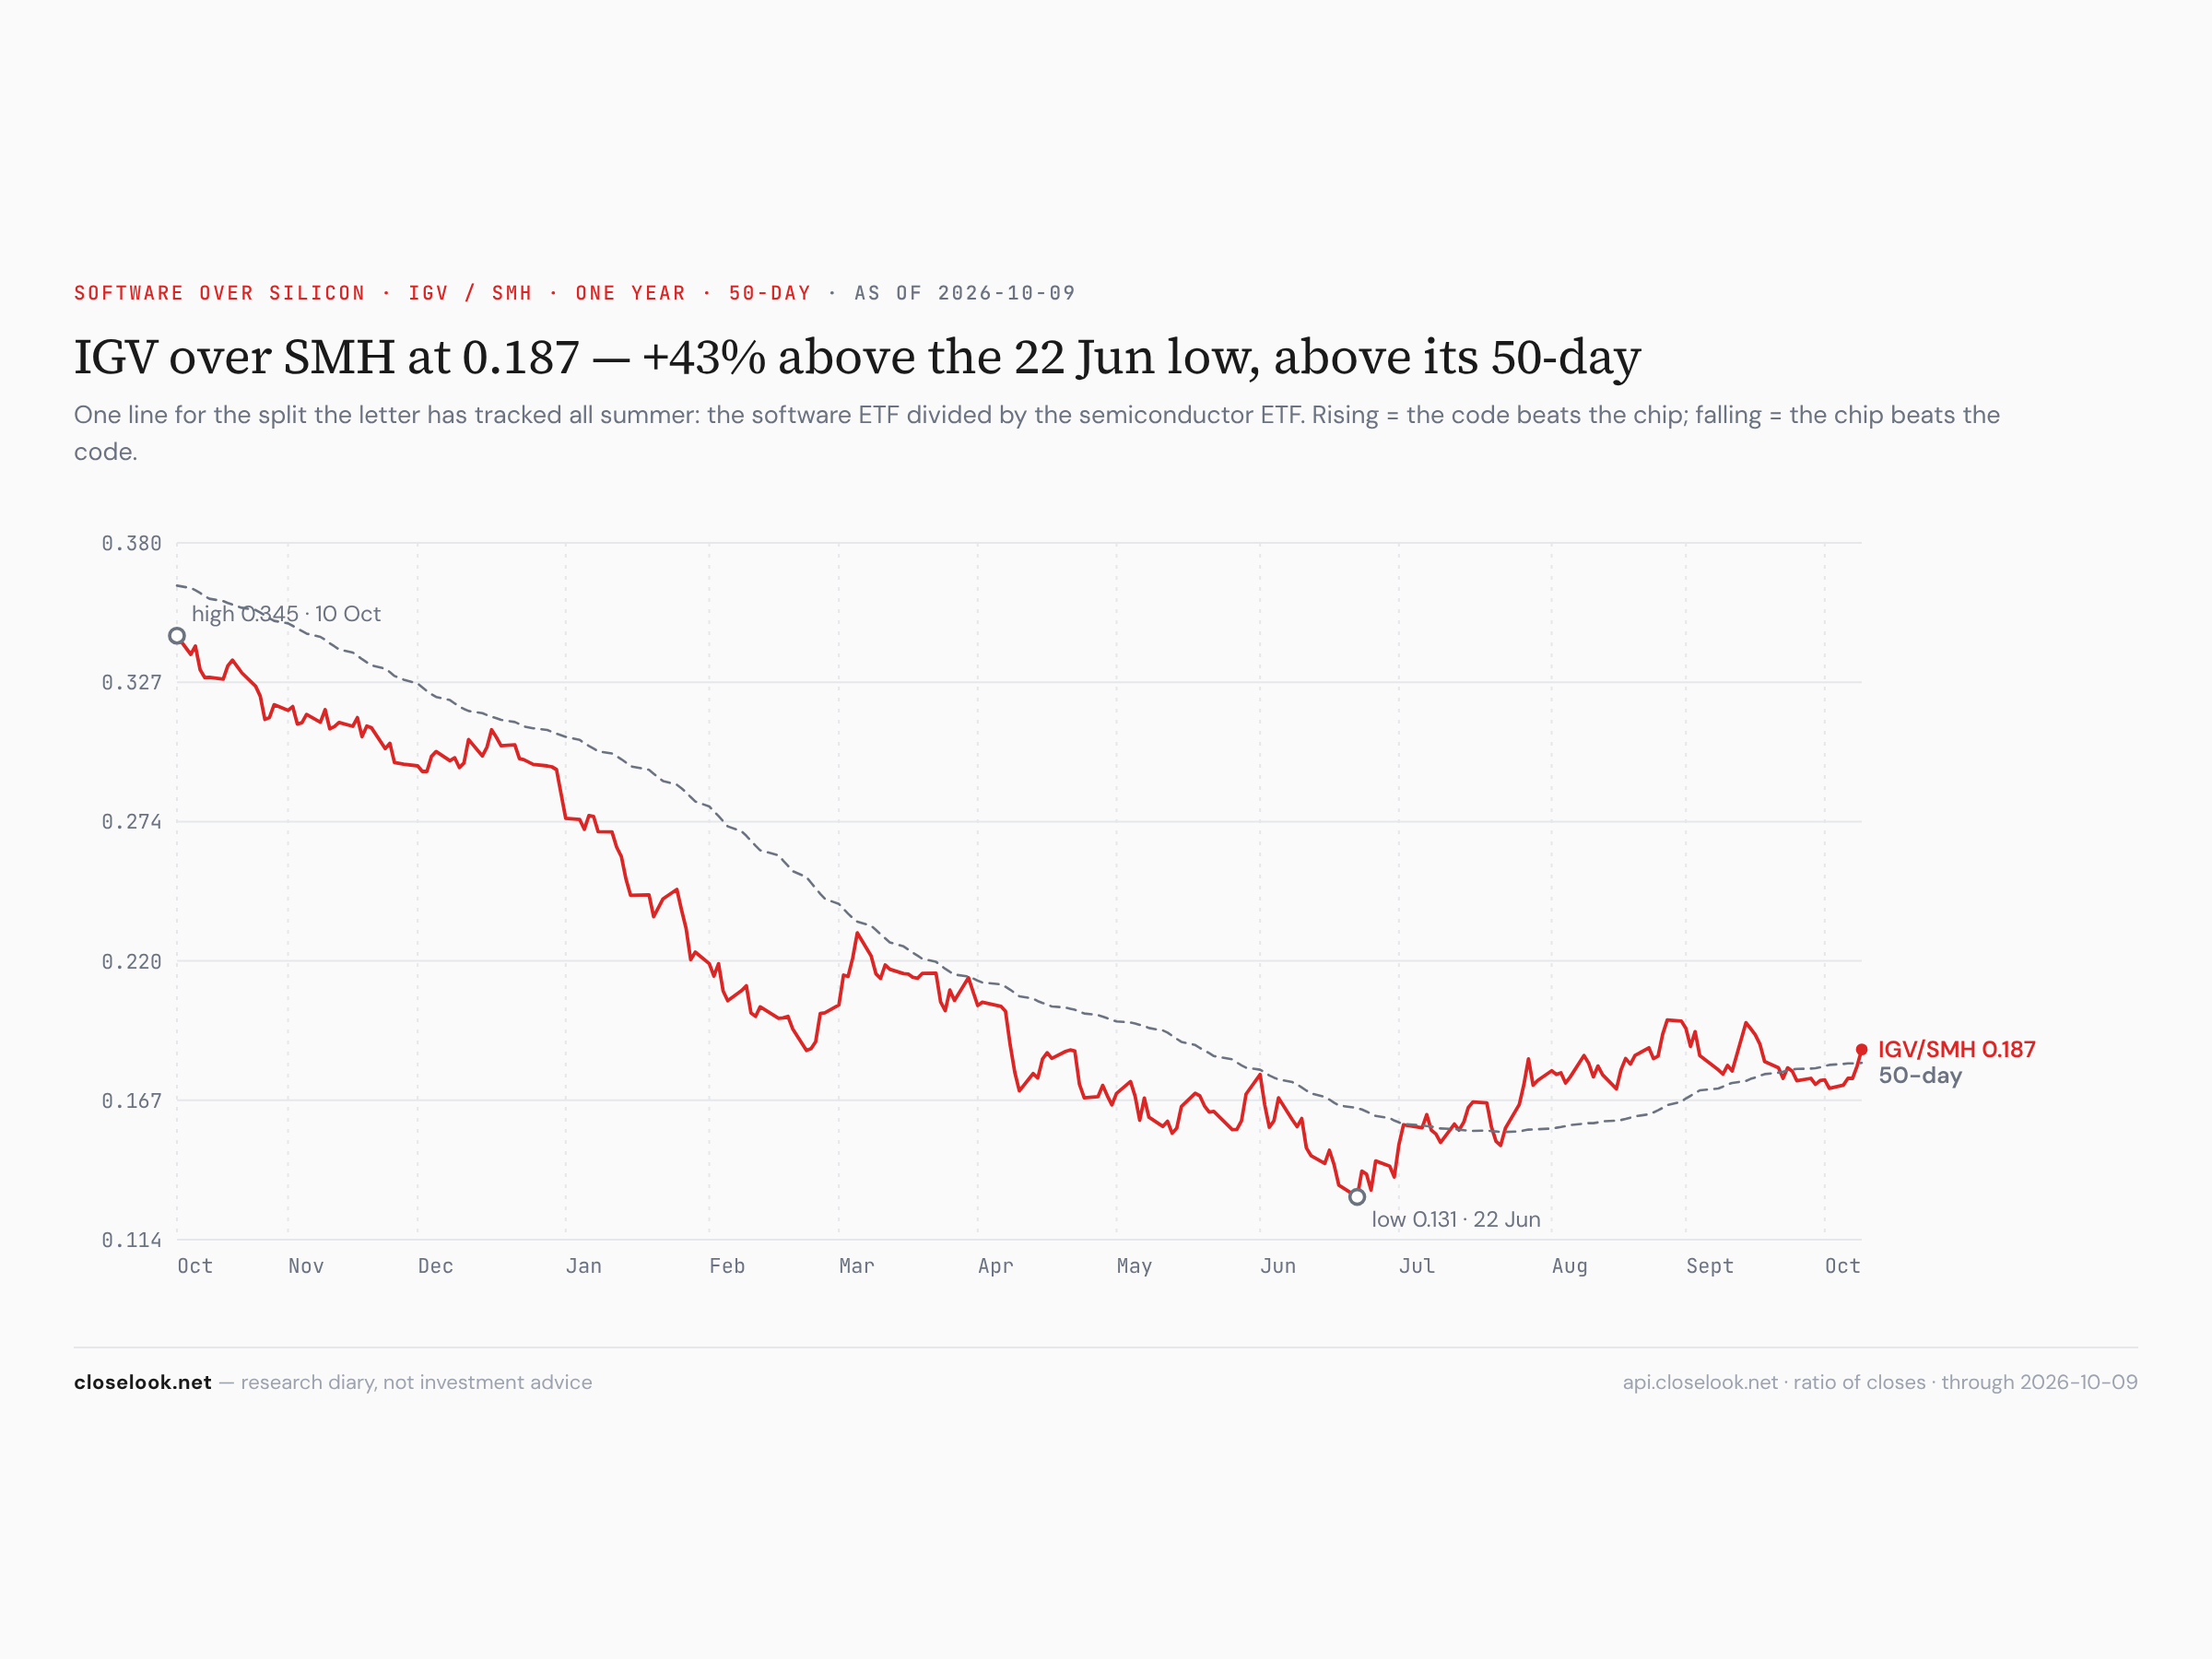
Inside technology — software up, chips down. The word "tech" hid two opposite weeks. Software rose: the cybersecurity fund CIBR +5.1%, the cloud fund CLOU +4.5%, software IGV +3.9% to 112.67, its highest close of 2026, internet FDN +3.3%. Chips fell: the semiconductor index −4.3%, the chip majors fund SMH −4.3%, equal-weight semis XSD −4.9%, the memory vehicle DRAM −7.4%. The money left the companies that build AI and went to the companies that run it and sell it. Global tech, which is mostly chips and the platforms, fell 1.4%. Friday's Pulse put it in four words — capex sold, apps bought — and this week the map followed: the countries that build lost, the countries that do not build gained.
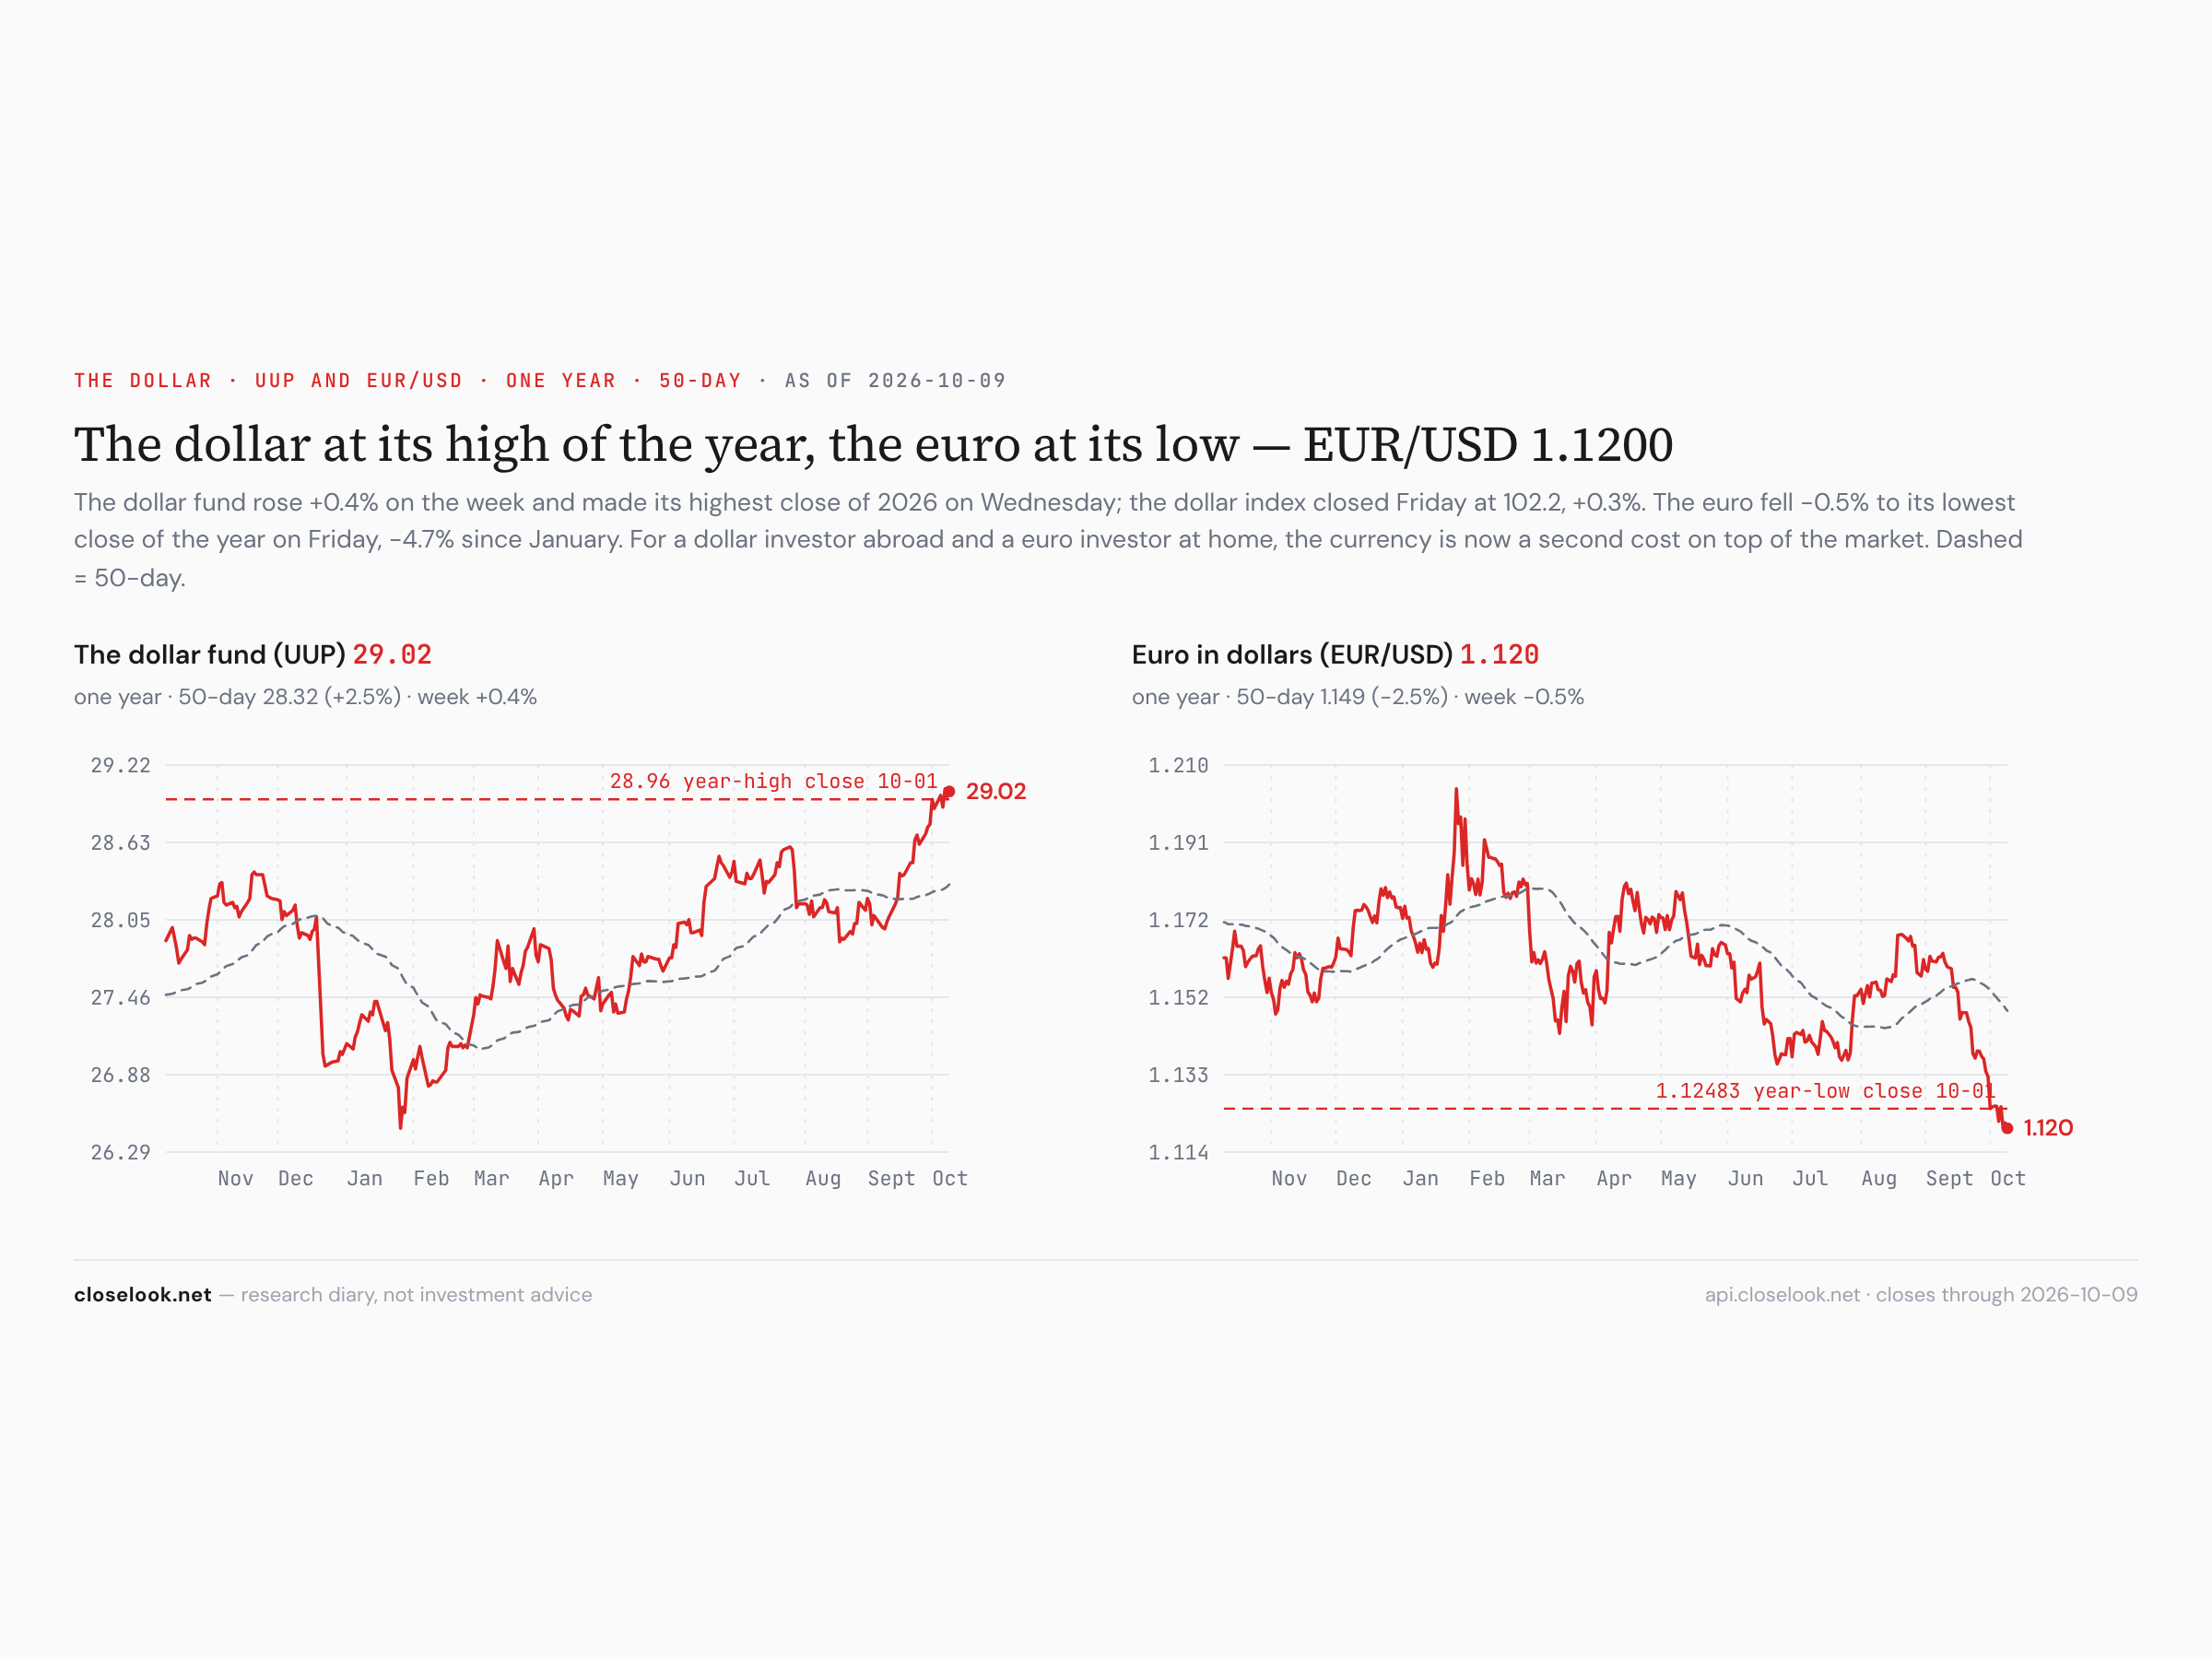
The dollar — another high, and the euro at its low. The dollar fund made a new high close of the year on Wednesday at 29.04 and ended at 29.02, +0.45%; the dollar index closed at 102.23. EUR/USD fell 0.47% to 1.1200 — the euro's lowest close of 2026, under last week's 1.1248, and down 4.4% since January. The yen closed at 158.26. A dollar investor in Europe lost on the currency again; a euro investor at home holds a currency that buys a little less of everything priced in dollars every week.
The regional board — fourteen green of thirty-five. The top: Brazil +14.01%, Argentina +4.78%, China large caps +3.16%, Hong Kong +2.27%, Poland +1.84%, Indonesia +1.80%, Mexico +1.21%. The bottom: Korea −7.63%, Southeast Asia −3.34%, Austria −3.11%, the Netherlands −1.83%, Taiwan −1.74%, France −1.68%, the Euro Stoxx 50 −1.61%. Last week five were green; this week fourteen. The best-to-worst spread was 21.6 points, from 8.9 a week ago — one market up fourteen, one down eight. A board that turns greener while its leaders fall is money rotating, not money leaving.
| Symbol | Name | Last | 5D | 1M | 3M | 6M | YTD |
|---|---|---|---|---|---|---|---|
| EWZ | iShares MSCI Brazil | 43.54 | +14.01% | +14.37% | +24.54% | +7.40% | +37.05% |
| ARGT | Global X - MSCI Argentina | 88.56 | +4.78% | -7.87% | -3.98% | -5.72% | -3.12% |
| FXI | iShares China Large-Cap | 34.24 | +3.16% | -0.90% | +2.48% | -5.65% | -10.58% |
| EWH | iShares MSCI Hong Kong | 22.06 | +2.27% | -2.78% | +4.01% | -7.47% | +3.81% |
| EPOL | iShares MSCI Poland | 43.82 | +1.84% | -3.80% | +10.71% | +12.13% | +24.52% |
| EIDO | iShares MSCI Indonesia | 11.89 | +1.80% | -9.44% | +0.76% | -25.08% | -36.42% |
| EWW | iShares MSCI Mexico | 71.95 | +1.21% | -5.95% | -3.08% | -9.42% | +3.78% |
| EWA | iShares MSCI Australia | 28.62 | +1.06% | -3.38% | +1.49% | -3.86% | +9.28% |
| EWL | iShares MSCI Switzerland | 59.75 | +0.88% | -1.66% | -5.11% | -1.32% | -0.35% |
| EFAV | iShares MSCI EAFE Min Vol Fact | 91.64 | +0.75% | -2.04% | +2.53% | -1.93% | +6.25% |
| EWU | iShares MSCI United Kingdom | 46.52 | +0.74% | -2.74% | +0.24% | -2.35% | +5.78% |
| VT | Vanguard Total World Stock | 159.83 | +0.44% | -0.04% | +1.80% | +10.27% | +13.31% |
| VWO | Vanguard FTSE Emerging Markets | 59.76 | +0.34% | -1.82% | +0.45% | +5.88% | +11.16% |
| ENOR | iShares MSCI Norway | 35.36 | +0.17% | -6.38% | +8.30% | -5.78% | +22.86% |
| THD | iShares MSCI Thailand | 71.61 | -0.01% | -4.30% | -0.58% | +0.52% | +20.01% |
| VSS | Vanguard FTSE All-World ex-US | 155.12 | -0.34% | -2.75% | +1.17% | +1.27% | +8.23% |
| EFV | iShares MSCI EAFE Value | 78.19 | -0.38% | -4.25% | +0.46% | +0.83% | +9.49% |
| ASHR | Xtrackers Harvest CSI 300 Chin | 32.38 | -0.40% | -4.88% | -9.75% | -3.08% | -1.43% |
| ENZL | iShares MSCI New Zealand | 44.74 | -0.53% | -4.01% | -2.99% | +0.05% | -1.17% |
| EFG | iShares MSCI EAFE Growth | 120.3 | -0.64% | -1.56% | -1.77% | +1.85% | +5.60% |
| EWP | iShares MSCI Spain | 57.9 | -0.70% | -5.99% | -2.15% | +0.82% | +7.40% |
| VEU | Vanguard FTSE All-World ex-US | 82.82 | -0.75% | -3.01% | -0.42% | +4.82% | +12.59% |
| EWG | iShares MSCI Germany | 40.96 | -0.82% | -4.83% | -1.40% | -1.59% | -3.62% |
| INDA | iShares MSCI India | 46.03 | -1.05% | -5.42% | -6.10% | -6.20% | -14.84% |
| EWJ | iShares MSCI Japan | 97.86 | -1.07% | +0.89% | +4.64% | +10.93% | +21.20% |
| VEA | Vanguard FTSE Developed Market | 70.35 | -1.10% | -3.39% | -0.54% | +4.15% | +12.61% |
| IMTM | iShares MSCI Intl Momentum Fac | 52.3 | -1.41% | -2.70% | -0.30% | +1.79% | +9.03% |
| EWM | iShares MSCI Malaysia | 26.66 | -1.48% | -4.82% | -2.13% | -6.65% | -2.56% |
| FEZ | EURO STOXX 50 | 65.92 | -1.61% | -5.44% | -3.26% | +0.23% | +2.38% |
| EWQ | iShares MSCI France | 41.52 | -1.68% | -7.51% | -7.82% | -9.48% | -7.71% |
| EWT | iShares MSCI Taiwan | 114.31 | -1.74% | +2.28% | +8.81% | +49.60% | +79.93% |
| EWN | iShares MSCI Netherlands | 66.64 | -1.83% | -2.70% | -2.10% | +7.76% | +16.85% |
| EWO | iShares MSCI Austria | 40.46 | -3.11% | -9.00% | -4.71% | +7.58% | +14.07% |
| ASEA | Global X - FTSE Southeast Asia | 20.25 | -3.34% | -7.11% | -1.22% | +1.96% | +10.48% |
| EWY | iShares MSCI South Korea | 177.24 | -7.63% | -7.10% | -4.06% | +27.25% | +82.31% |
Sorted by Weighted Alpha (leaders → laggards) · Barchart, close of week.
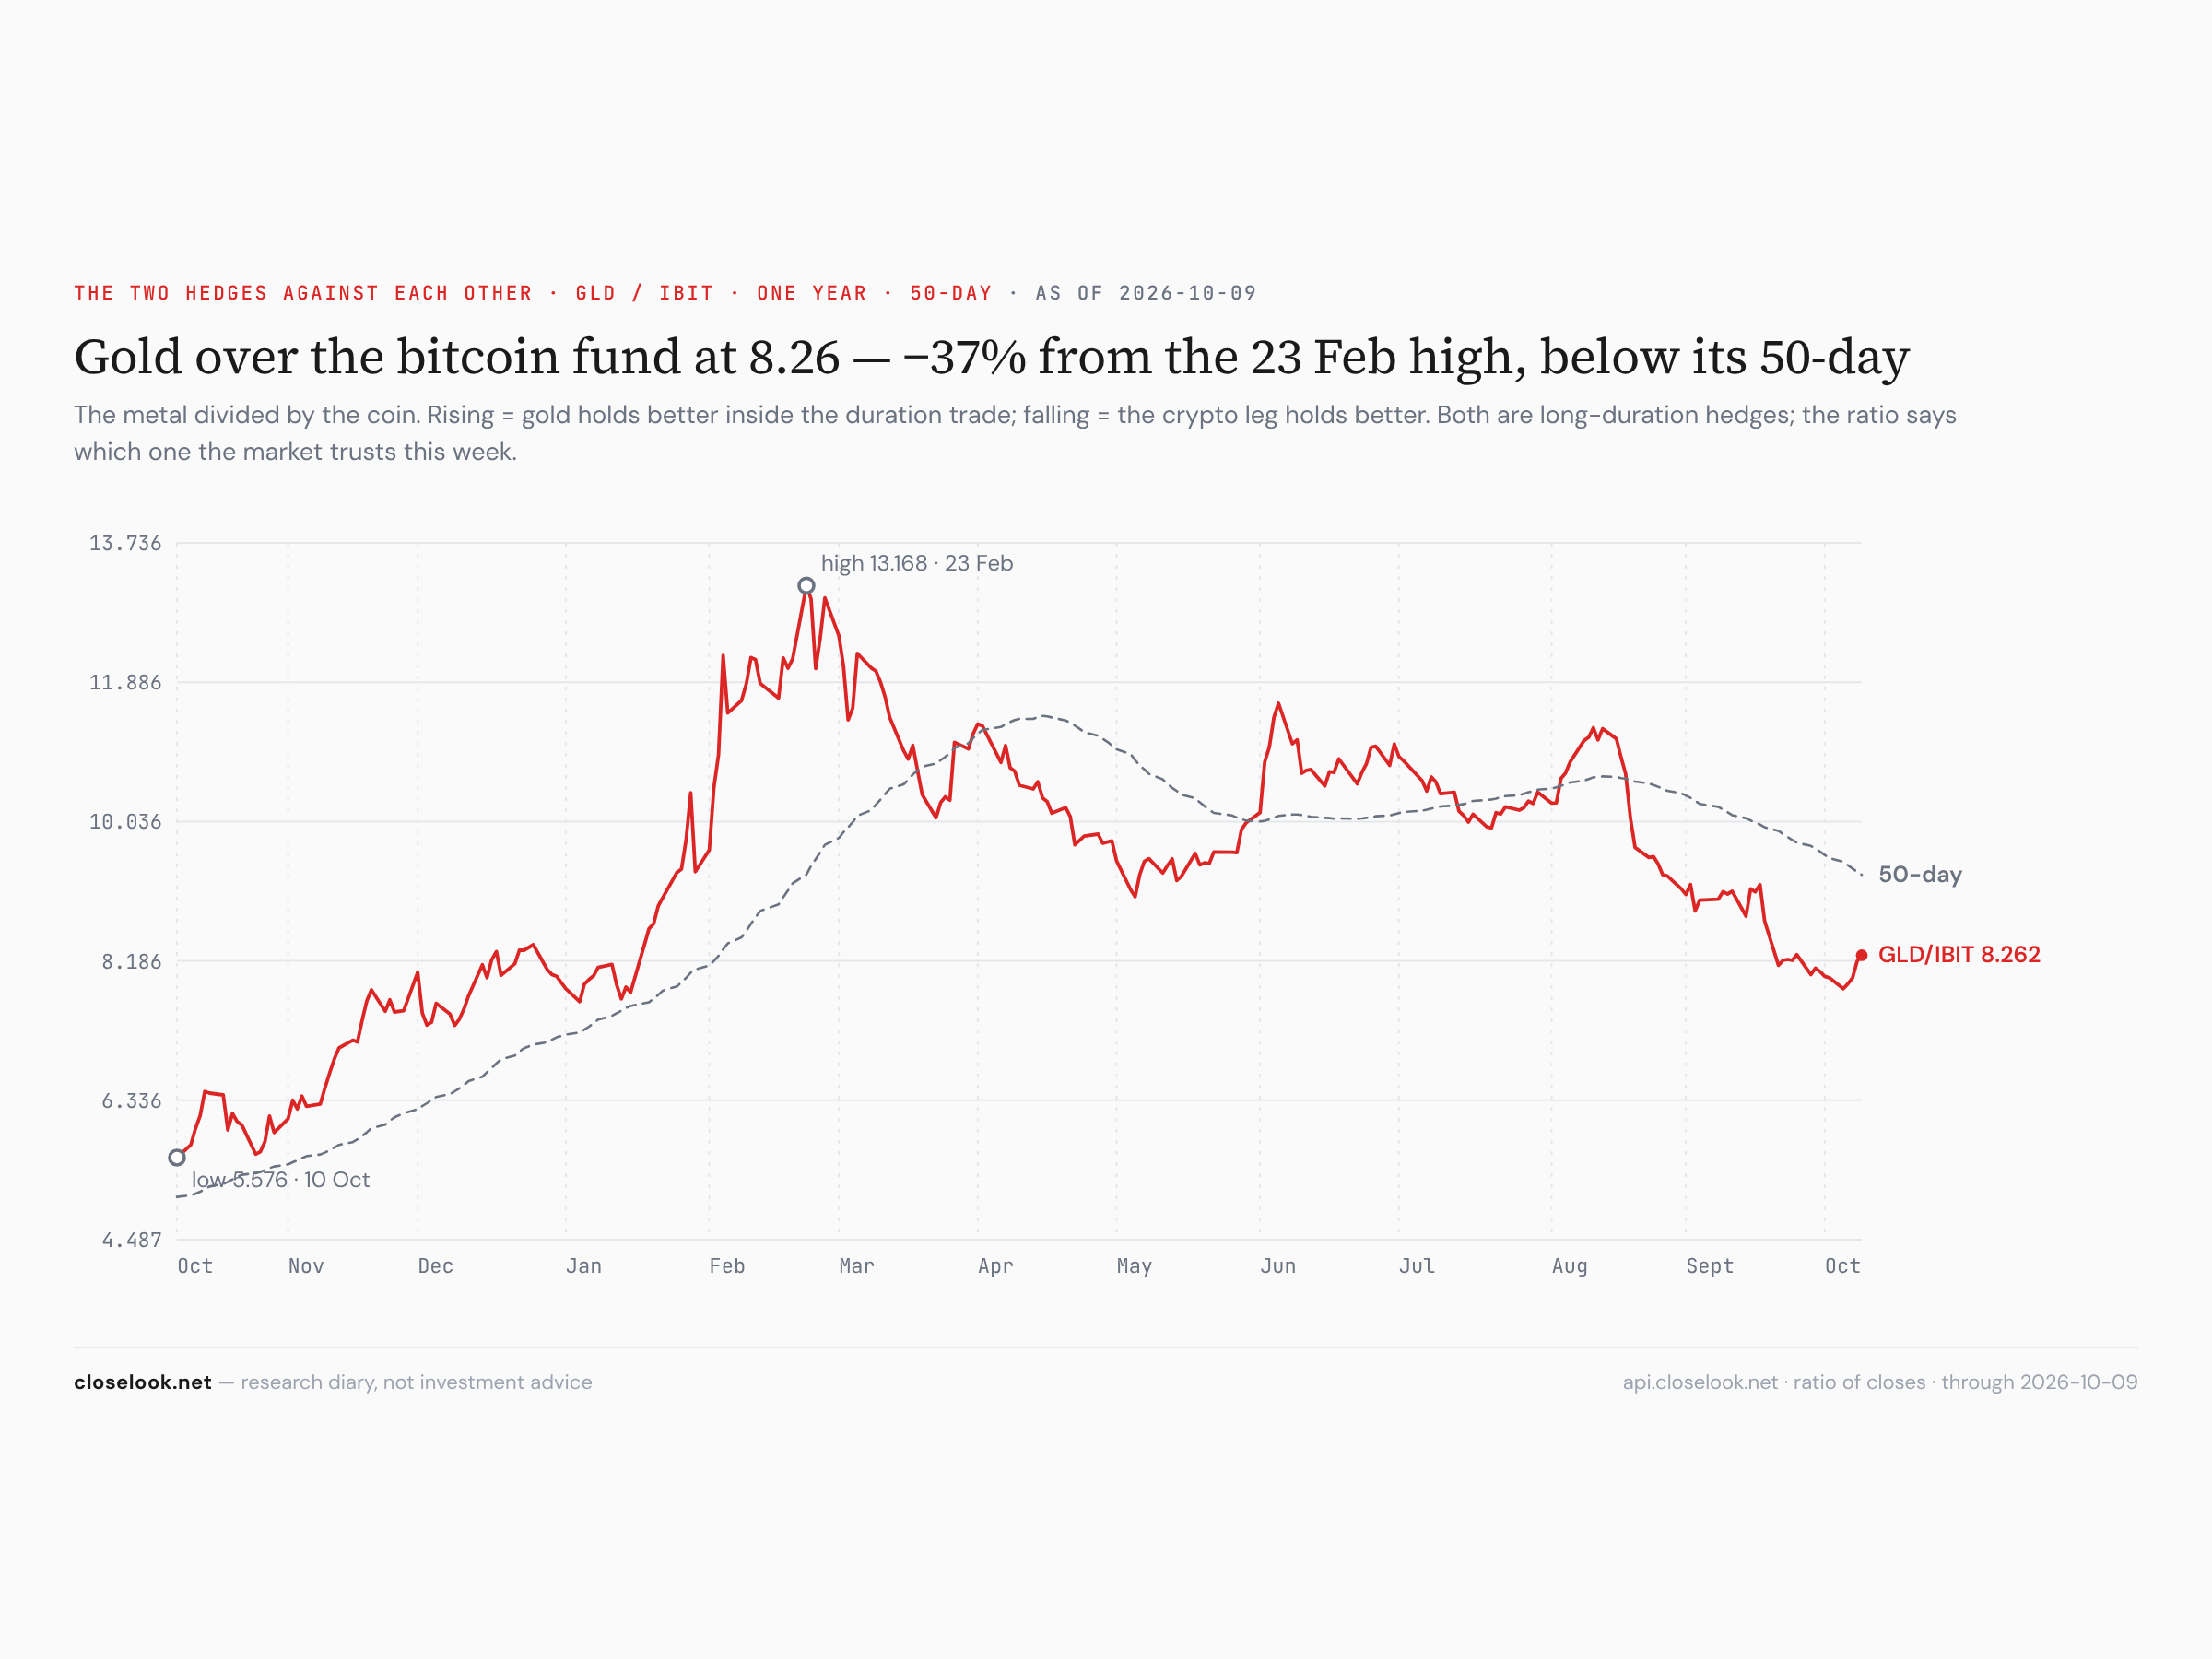
The cross-asset backdrop — gold up, the coin down. Nine green of twelve: gold +1.17%, the S&P +1.16%, the US top-20 fund +0.82%, the long bond +0.65%, oil +0.56%, the dollar +0.45%, the belly +0.39%, the Nasdaq 100 +0.23%, silver +0.07%. The red three: the bitcoin fund −2.47%, copper miners −0.19%, the Nasdaq top-30 fund −0.09%. Brent rose above 103 dollars a barrel on Thursday. The bond funds rose a little after Monday's new low; the coin lost its floor.
| Symbol | Name | Last | 5D | 1M | 3M | 6M | YTD |
|---|---|---|---|---|---|---|---|
| GLD | Gold Shares | 384.58 | +1.17% | -4.65% | +1.69% | -12.18% | -2.96% |
| SPY | S&P 500 | 778.57 | +1.16% | +2.12% | +3.57% | +14.51% | +14.17% |
| TOPT | iShares Top 20 U.S. Stocks | 35.5 | +0.82% | +4.66% | +6.51% | +18.41% | +13.67% |
| TLT | iShares 20+ Year Treasury Bond | 77.98 | +0.65% | -4.59% | -7.71% | -10.06% | -10.53% |
| USO | United States Oil LP | 148.2 | +0.56% | -1.18% | +35.95% | +16.73% | +114.29% |
| UUP | Invesco DB US Dollar Index Bul | 29.02 | +0.45% | +3.72% | +2.33% | +5.60% | +7.36% |
| IEF | iShares 7-10 Year Treasury Bon | 89.4 | +0.39% | -2.72% | -4.60% | -6.32% | -7.03% |
| QQQ | Invesco QQQ | 751.27 | +0.23% | +4.88% | +3.87% | +23.12% | +22.29% |
| SLV | iShares Silver | 54.78 | +0.07% | -9.78% | +1.18% | -19.90% | -14.96% |
| QTOP | iShares Nasdaq Top 30 Stocks | 39.75 | -0.09% | +5.66% | +4.85% | +24.37% | +24.37% |
| COPX | Global X - Copper Miners | 85.75 | -0.19% | -9.99% | +13.73% | +5.14% | +19.45% |
| IBIT | iShares Bitcoin | 46.55 | -2.47% | +5.10% | +29.99% | +13.79% | -6.24% |
Sorted by Weighted Alpha (leaders → laggards) · Barchart, close of week.
The US sectors — ten of eleven green. Utilities +4.0%, staples +3.6%, energy +3.6%, health care +2.8%, consumer discretionary +2.6%, financials +2.3%, real estate +2.0%. The two red: technology −0.5% and industrials −0.4%. The equal-weight S&P rose 1.58%, the S&P 1.16%, the Nasdaq 100 0.23%; small caps fell 0.92%. Last week one sector carried the index. This week every sector but the one that led the year rose — and the average stock beat the index.
| Symbol | Name | Last | 5D | 1M | 3M | 6M | YTD |
|---|---|---|---|---|---|---|---|
| XLU | Utilities | 41.41 | +3.97% | -3.56% | -8.24% | -12.17% | -3.00% |
| XLP | Consumer Staples | 83.43 | +3.60% | +0.46% | +0.28% | -0.02% | +7.40% |
| XLE | Energy | 65.08 | +3.60% | -0.35% | +18.72% | +13.52% | +45.56% |
| XLV | Health Care | 170.81 | +2.79% | +2.54% | +5.33% | +14.38% | +10.34% |
| XLY | Consumer Discretionary | 112.85 | +2.55% | +0.35% | -3.42% | +0.10% | -5.49% |
| XLF | Financial | 54.73 | +2.32% | -4.08% | -1.46% | +6.62% | -0.07% |
| XLRE | Real Estate | 41.61 | +1.96% | -4.15% | -5.92% | -2.62% | +3.12% |
| XLB | Materials | 49.43 | +1.17% | -3.81% | -1.65% | -4.34% | +9.00% |
| XLC | Communication Services | 110.38 | +0.05% | -0.41% | -0.12% | -3.40% | -6.24% |
| XLI | Industrial | 169.25 | -0.41% | -1.48% | -6.55% | -1.71% | +9.11% |
| XLK | Technology | 198.78 | -0.52% | +5.81% | +7.25% | +39.92% | +38.07% |
Sorted by Weighted Alpha (leaders → laggards) · Barchart, close of week.
The tech ETFs — ten of twenty-one green, split down the middle. The green half is software and the internet: CIBR +5.06%, CLOU +4.51%, IGV +3.91%, FDN +3.28%, fintech +2.69%, gaming +2.62%, data centers +2.57%. The red half is silicon: digital transformation −6.75%, XSD −4.91%, SMH −4.32%, the Internet of Things −3.31%, the fabless fund −2.84%, the WisdomTree AI fund −2.62%, quantum −2.56%. Last week software rose with the chips. This week it rose against them.
| Symbol | Name | Last | 5D | 1M | 3M | 6M | YTD |
|---|---|---|---|---|---|---|---|
| CIBR | First Nasdaq Cybersecurity | 110 | +5.06% | +16.43% | +16.70% | +74.38% | +53.95% |
| CLOU | Global X - Cloud Computing | 30.11 | +4.51% | +10.05% | +24.89% | +60.93% | +33.11% |
| IGV | iShares Expanded Tech-Software | 112.67 | +3.91% | +10.65% | +20.01% | +47.01% | +6.60% |
| FDN | First Dow Jones Internet Index | 301.32 | +3.28% | +4.65% | +9.30% | +22.85% | +11.94% |
| FINX | Global X - FinTech | 24.99 | +2.69% | -4.05% | -2.44% | +7.92% | -15.07% |
| ESPO | VanEck Video Gaming and eSport | 100.11 | +2.62% | +4.22% | +7.84% | +11.43% | -3.38% |
| DTCR | Global X - Data Center & Digit | 27.97 | +2.57% | -1.62% | -3.92% | +7.45% | +32.56% |
| LIT | Global X - Lithium & Battery T | 69.73 | +0.65% | -5.48% | -4.24% | -9.13% | +7.51% |
| NLR | VanEck Uranium and Nuclear | 103.35 | +0.59% | -15.94% | -8.60% | -24.31% | -16.79% |
| AIQ | Global X - Artificial Intellig | 66.6 | +0.56% | +3.88% | +4.34% | +34.95% | +30.95% |
| ARKK | ARK Innovation | 89.62 | -0.23% | +5.98% | +9.92% | +30.03% | +16.51% |
| SHLD | Global X - Defense Tech | 59.87 | -0.60% | -3.19% | -2.59% | -19.37% | -7.59% |
| GRID | First NASDAQ Clean Edge Smart | 180.89 | -1.10% | +0.42% | -1.78% | +2.47% | +18.21% |
| BOTZ | Global X - Robotics & Artifici | 35.48 | -1.53% | +0.85% | -3.14% | +1.60% | -2.07% |
| QTUM | Defiance Quantum | 152.06 | -2.56% | +2.88% | -2.26% | +30.93% | +38.66% |
| WTAI | WisdomTree Artificial Intellig | 44.16 | -2.62% | +3.54% | +0.27% | +42.27% | +51.54% |
| SMHX | VanEck Fabless Semiconductor | 61.42 | -2.84% | +8.74% | -0.25% | +49.38% | +61.52% |
| SNSR | Global X - Internet of Things | 48.61 | -3.31% | +3.28% | -0.57% | +21.98% | +31.54% |
| SMH | VanEck Semiconductor | 603.33 | -4.32% | +5.06% | -0.72% | +40.21% | +67.53% |
| XSD | S&P Semiconductor | 527.93 | -4.91% | +6.51% | -7.30% | +44.92% | +64.16% |
| DAPP | VanEck Digital Transformation | 17.82 | -6.75% | -11.30% | -5.36% | +8.20% | +7.80% |
Sorted by Weighted Alpha (leaders → laggards) · Barchart, close of week.
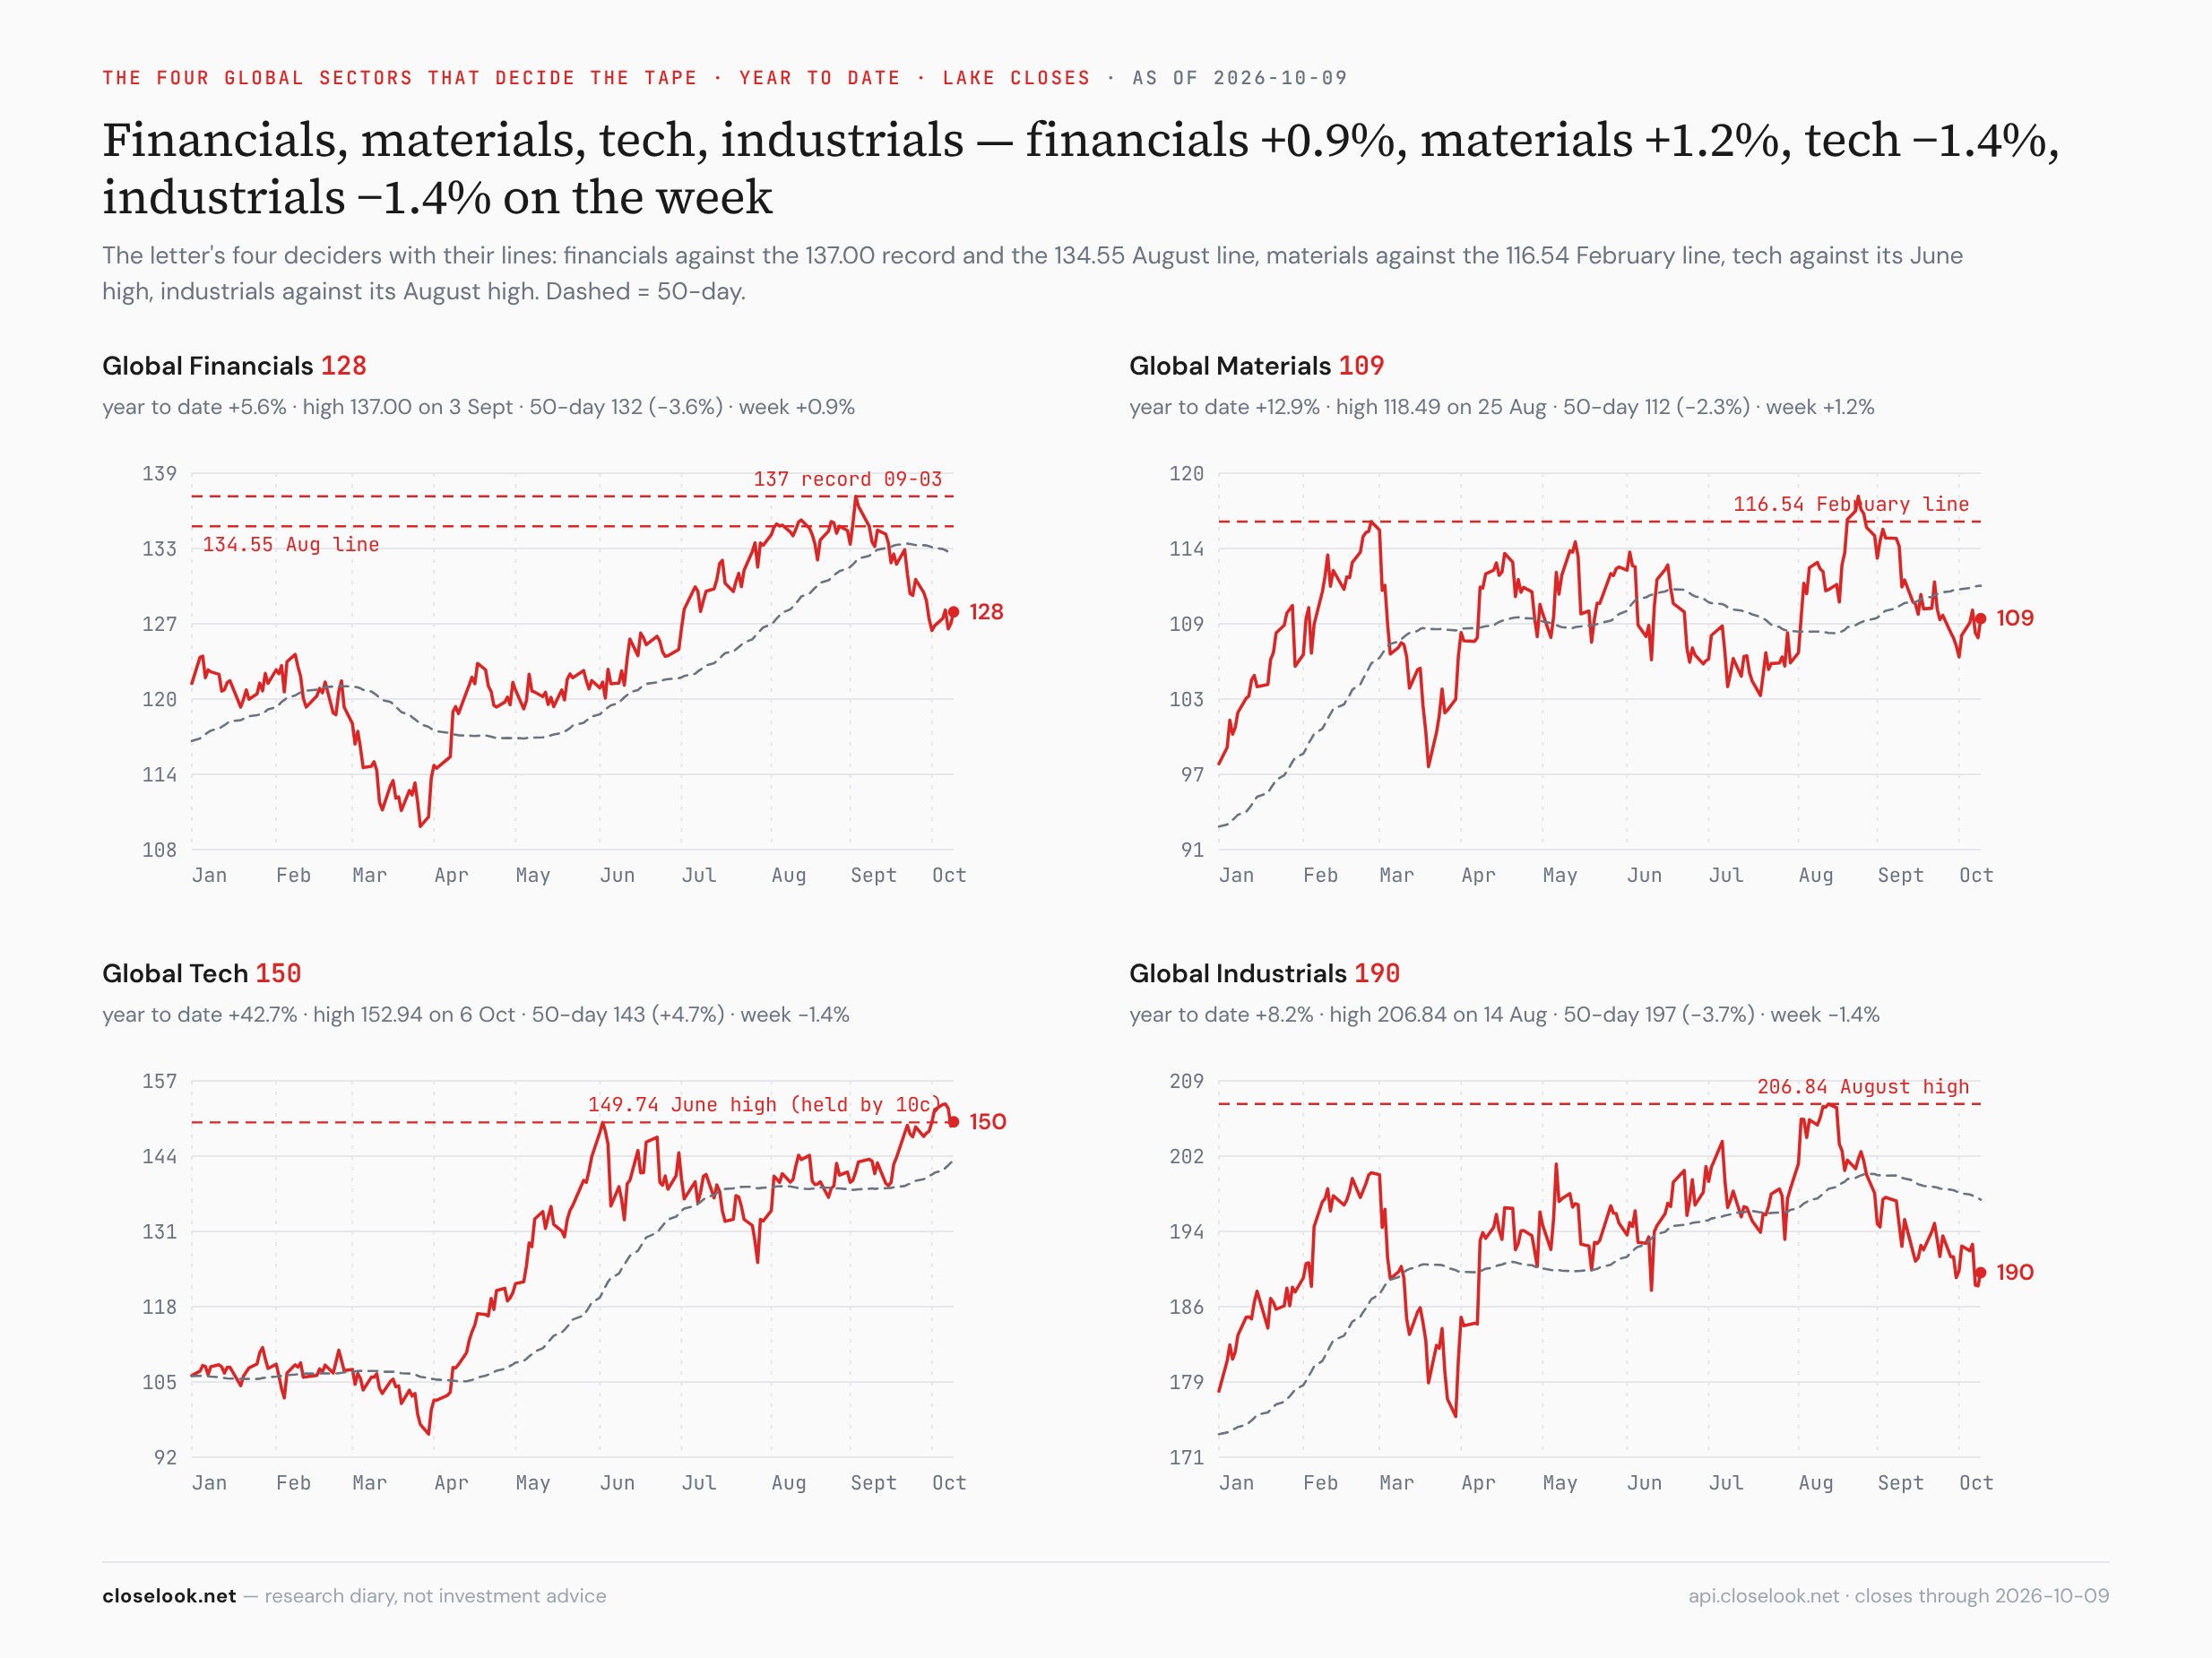
The global sectors — the defensives led. Nine of eleven green: staples +3.45%, energy +3.44%, utilities +2.72%, health care +2.29%, discretionary +2.07%, materials +1.19%, financials +0.89%. The red two: industrials −1.41% and technology −1.38%. Global tech closed at 149.84 — ten cents above the 149.74 June high this letter named as the line from above. Financials spent a fifth week under the 134.55 August line, materials a seventh under the February line.
| Symbol | Name | Last | 5D | 1M | 3M | 6M | YTD |
|---|---|---|---|---|---|---|---|
| KXI | iShares Global Consumer Staple | 67.4 | +3.45% | +0.48% | -0.40% | -1.72% | +4.25% |
| IXC | iShares Global Energy | 59.88 | +3.44% | +0.00% | +17.94% | +9.07% | +42.81% |
| JXI | iShares Global Utilities | 79.57 | +2.72% | -2.38% | -6.08% | -11.00% | +1.17% |
| IXJ | iShares Global Healthcare | 103.17 | +2.29% | +1.75% | +3.23% | +7.97% | +5.92% |
| RXI | iShares Global Consumer Discre | 189.26 | +2.07% | -0.96% | -3.24% | -2.59% | -7.80% |
| MXI | iShares Global Materials | 109.08 | +1.19% | -4.86% | +4.03% | -2.10% | +12.87% |
| IXG | iShares Global Financials | 127.56 | +0.89% | -4.29% | -0.72% | +6.46% | +5.60% |
| VT | Vanguard Total World Stock | 159.83 | +0.44% | -0.04% | +1.80% | +10.27% | +13.31% |
| REET | iShares Global REIT | 25.69 | +0.20% | -5.17% | -7.42% | -2.54% | +2.97% |
| IXP | iShares Global Comm Services | 117.32 | -0.44% | -0.76% | +0.67% | -1.44% | -3.22% |
| IXN | iShares Global Tech | 149.84 | -1.38% | +4.75% | +6.70% | +39.75% | +42.70% |
| EXI | iShares Global Industrials | 189.76 | -1.41% | -2.49% | -3.73% | -2.08% | +8.22% |
Sorted by Weighted Alpha (leaders → laggards) · Barchart, close of week.
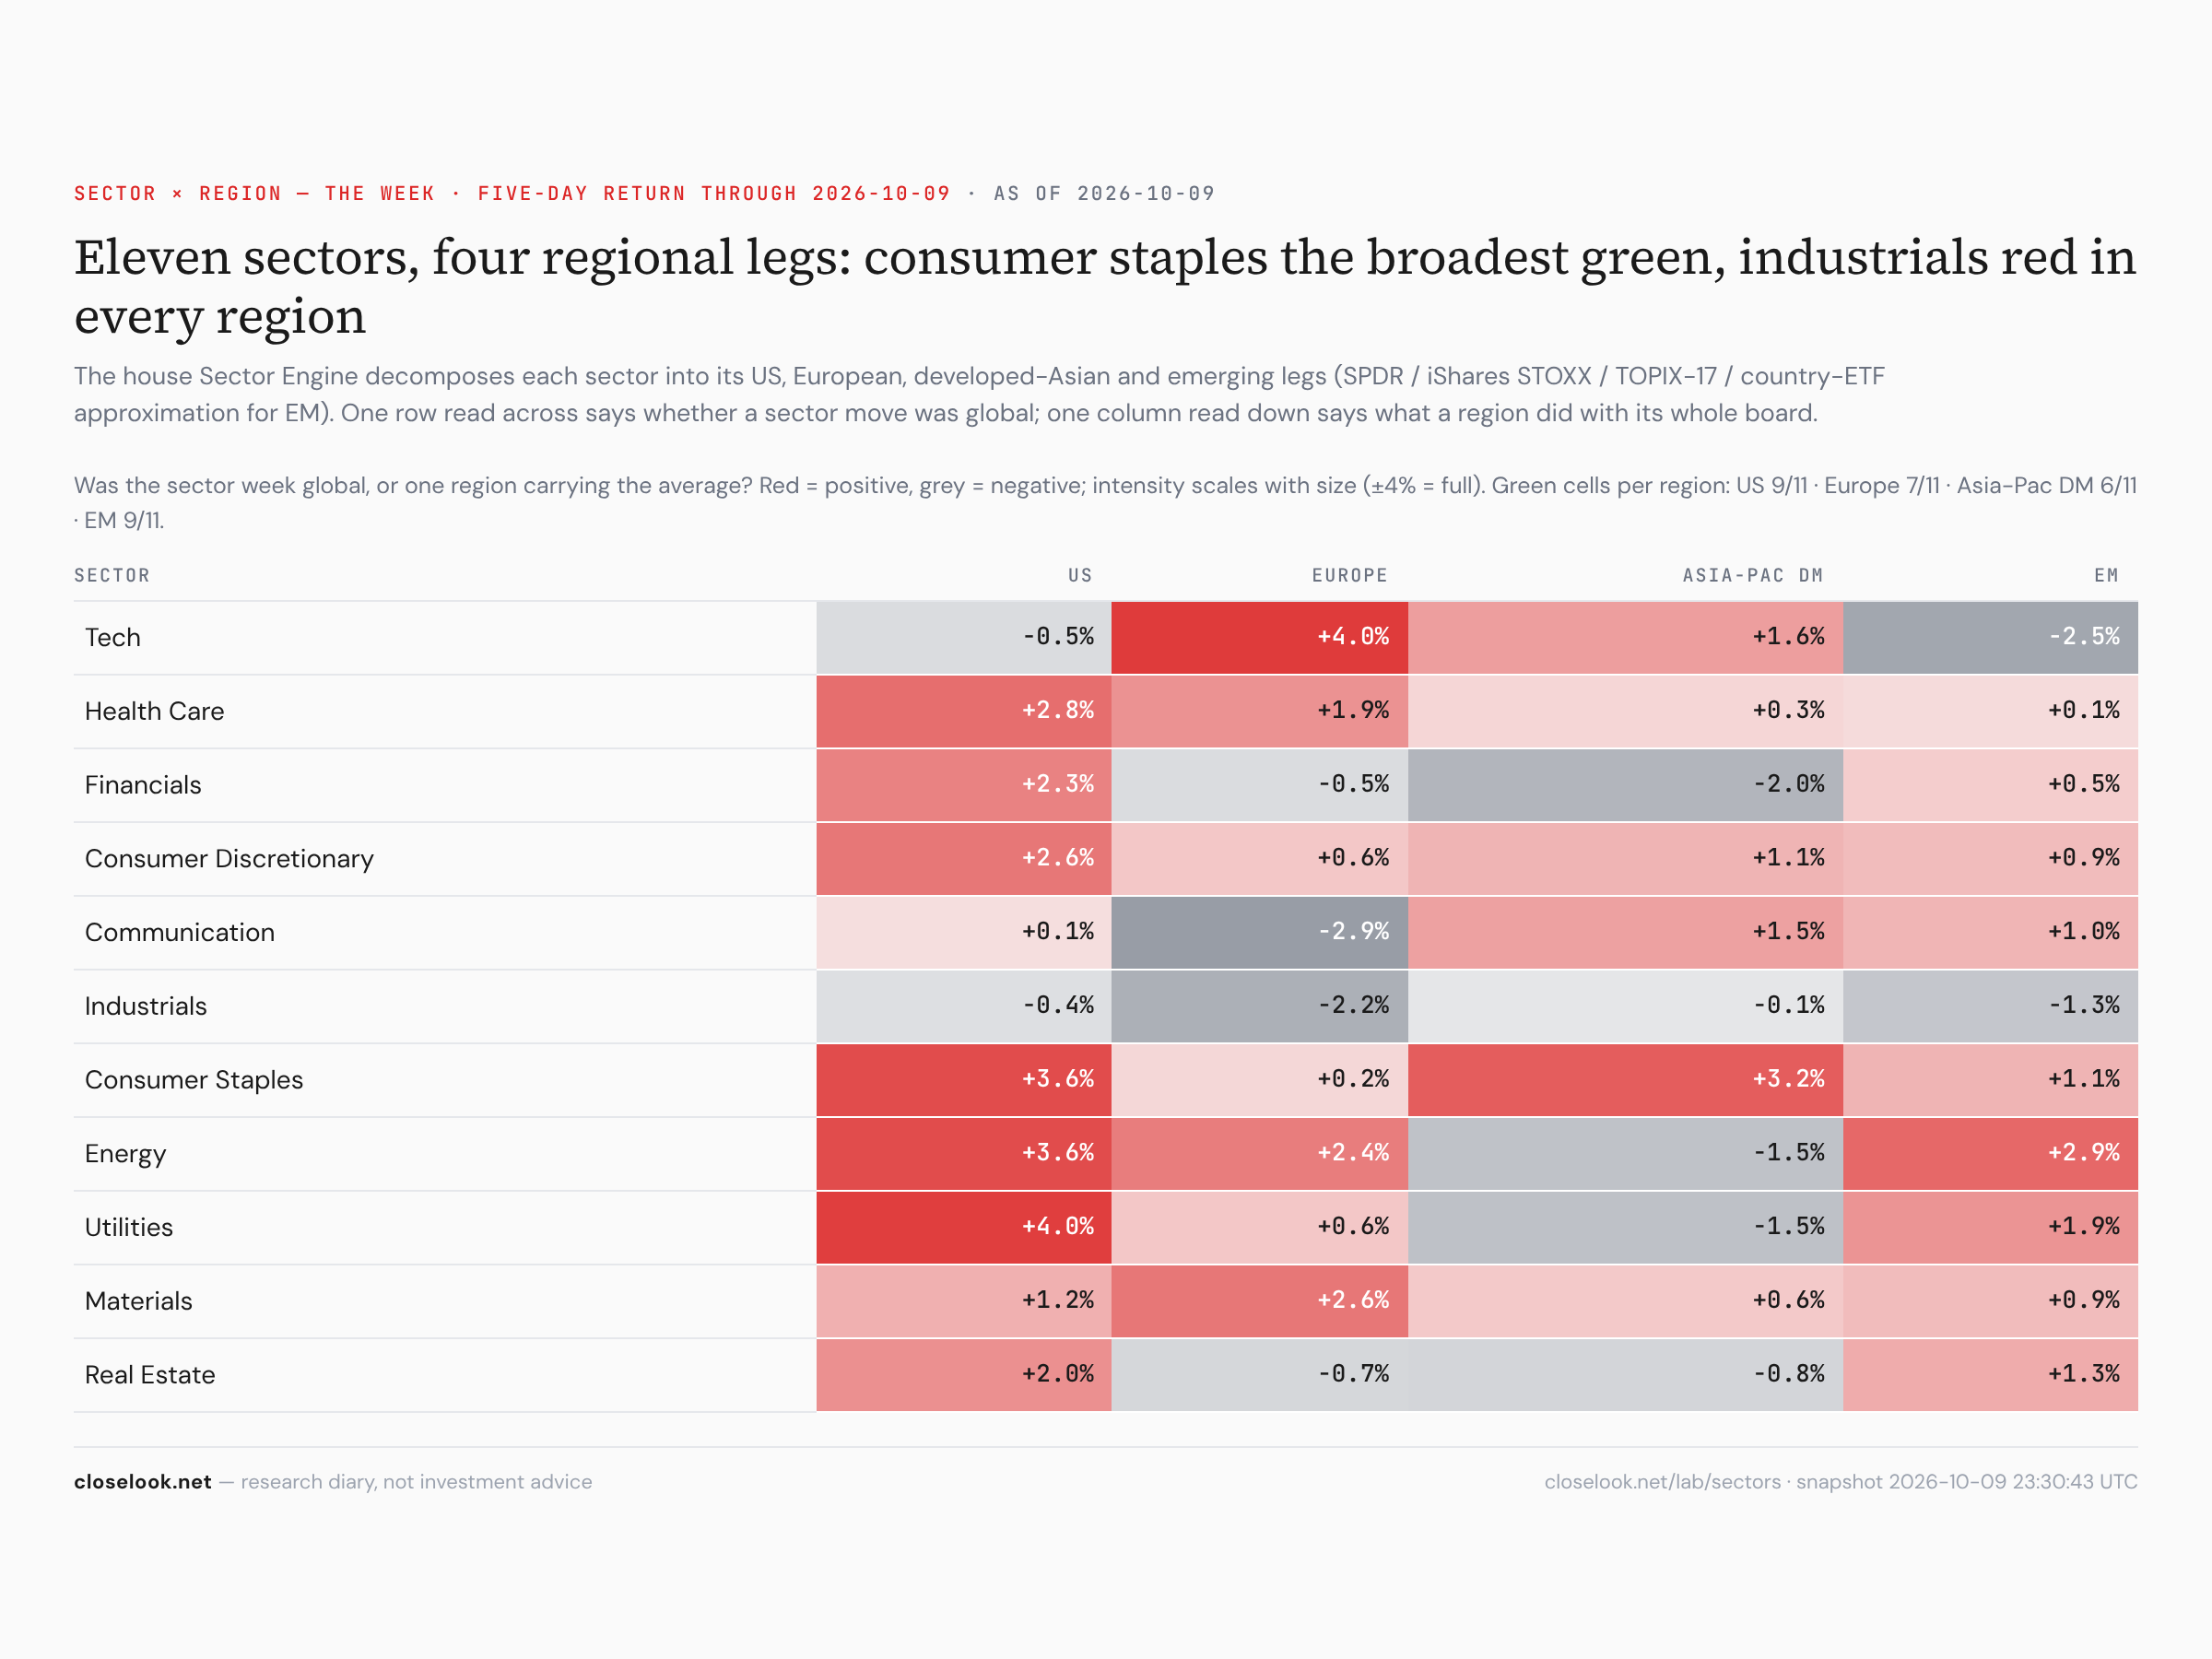
Was the sector week global, or one region carrying it? The house Sector Engine splits each sector into four regional legs. Technology rose in Europe (+4.0%) and developed Asia (+1.6%) and fell in America (−0.5%) and emerging markets (−2.5%) — Europe's tech leg is heavy in software, emerging markets' in Korean and Taiwanese chips. Staples rose in all four regions, health care in all four. The US-minus-Europe spread was positive in nine sectors of eleven, staples and utilities +3.4 points each — and technology −4.5, the one sector where Europe beat America this week.
The Global Compass
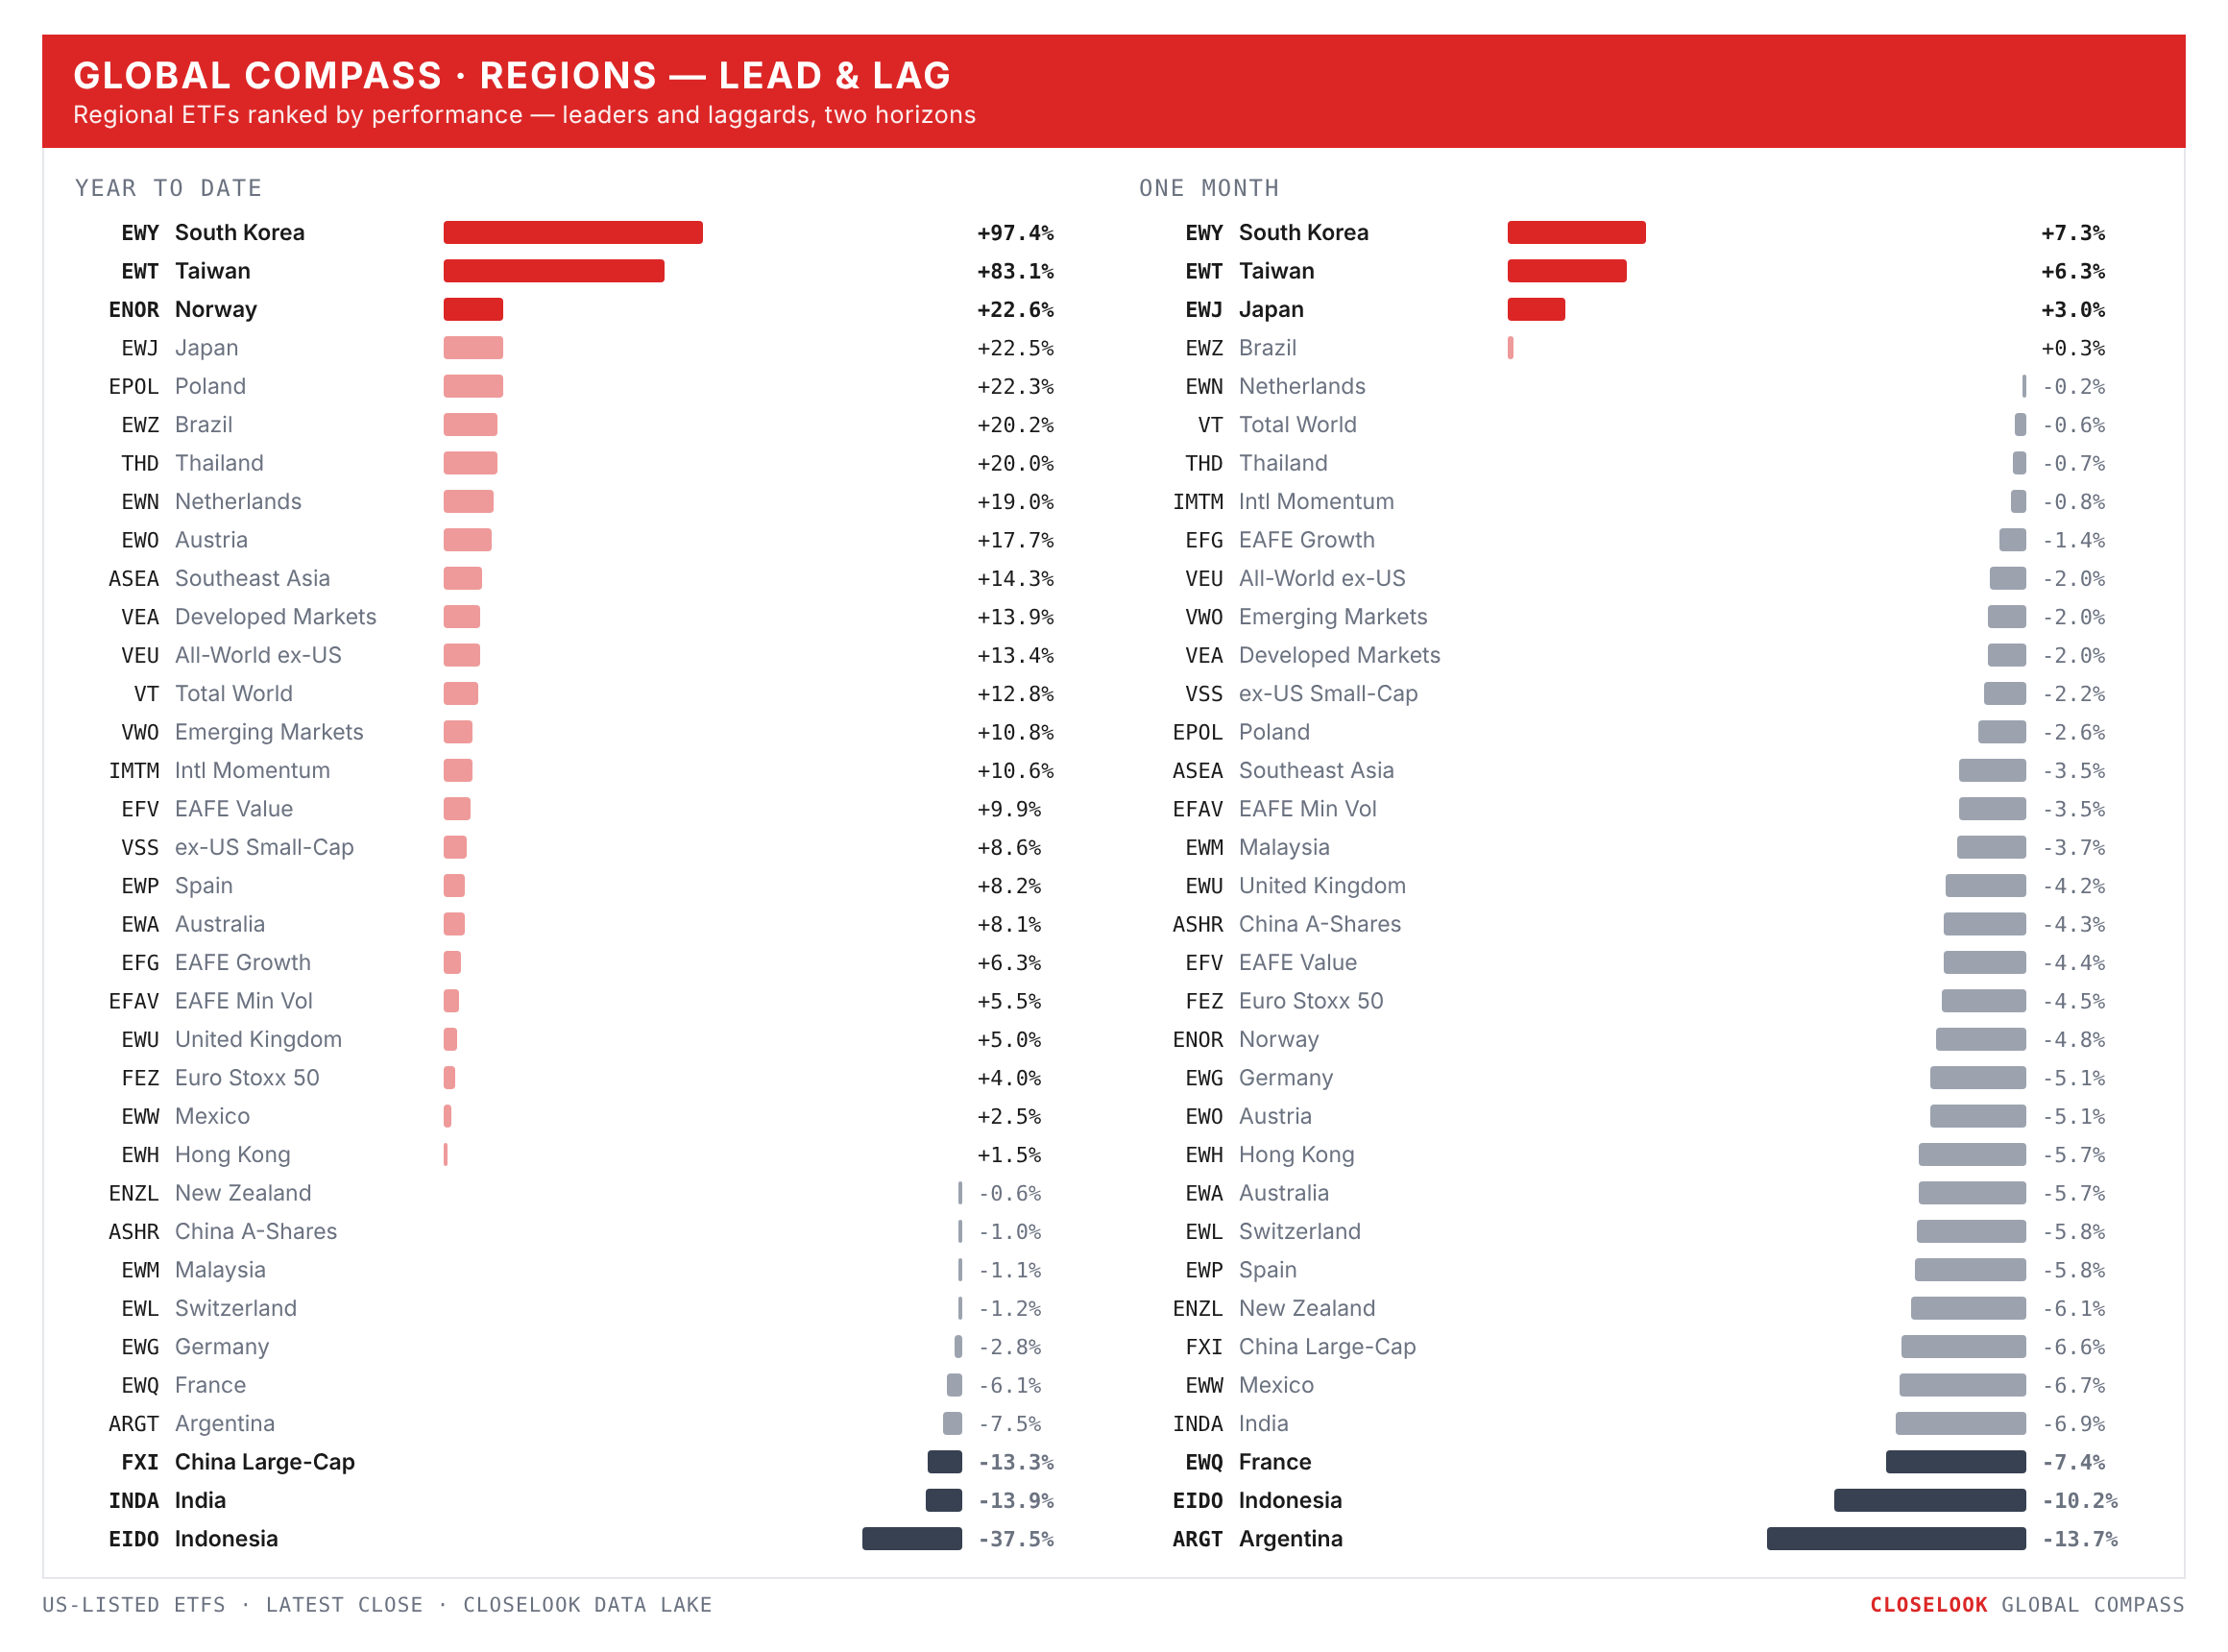
Regions: emerging over developed. VWO +0.34% against VEA −1.10% — a 1.4-point gap, with Latin America and China lifting the emerging basket while Korea and Taiwan pulled on it. China's large caps rose 3.2% as the mainland came back from Golden Week; its A-shares fell 0.4%.
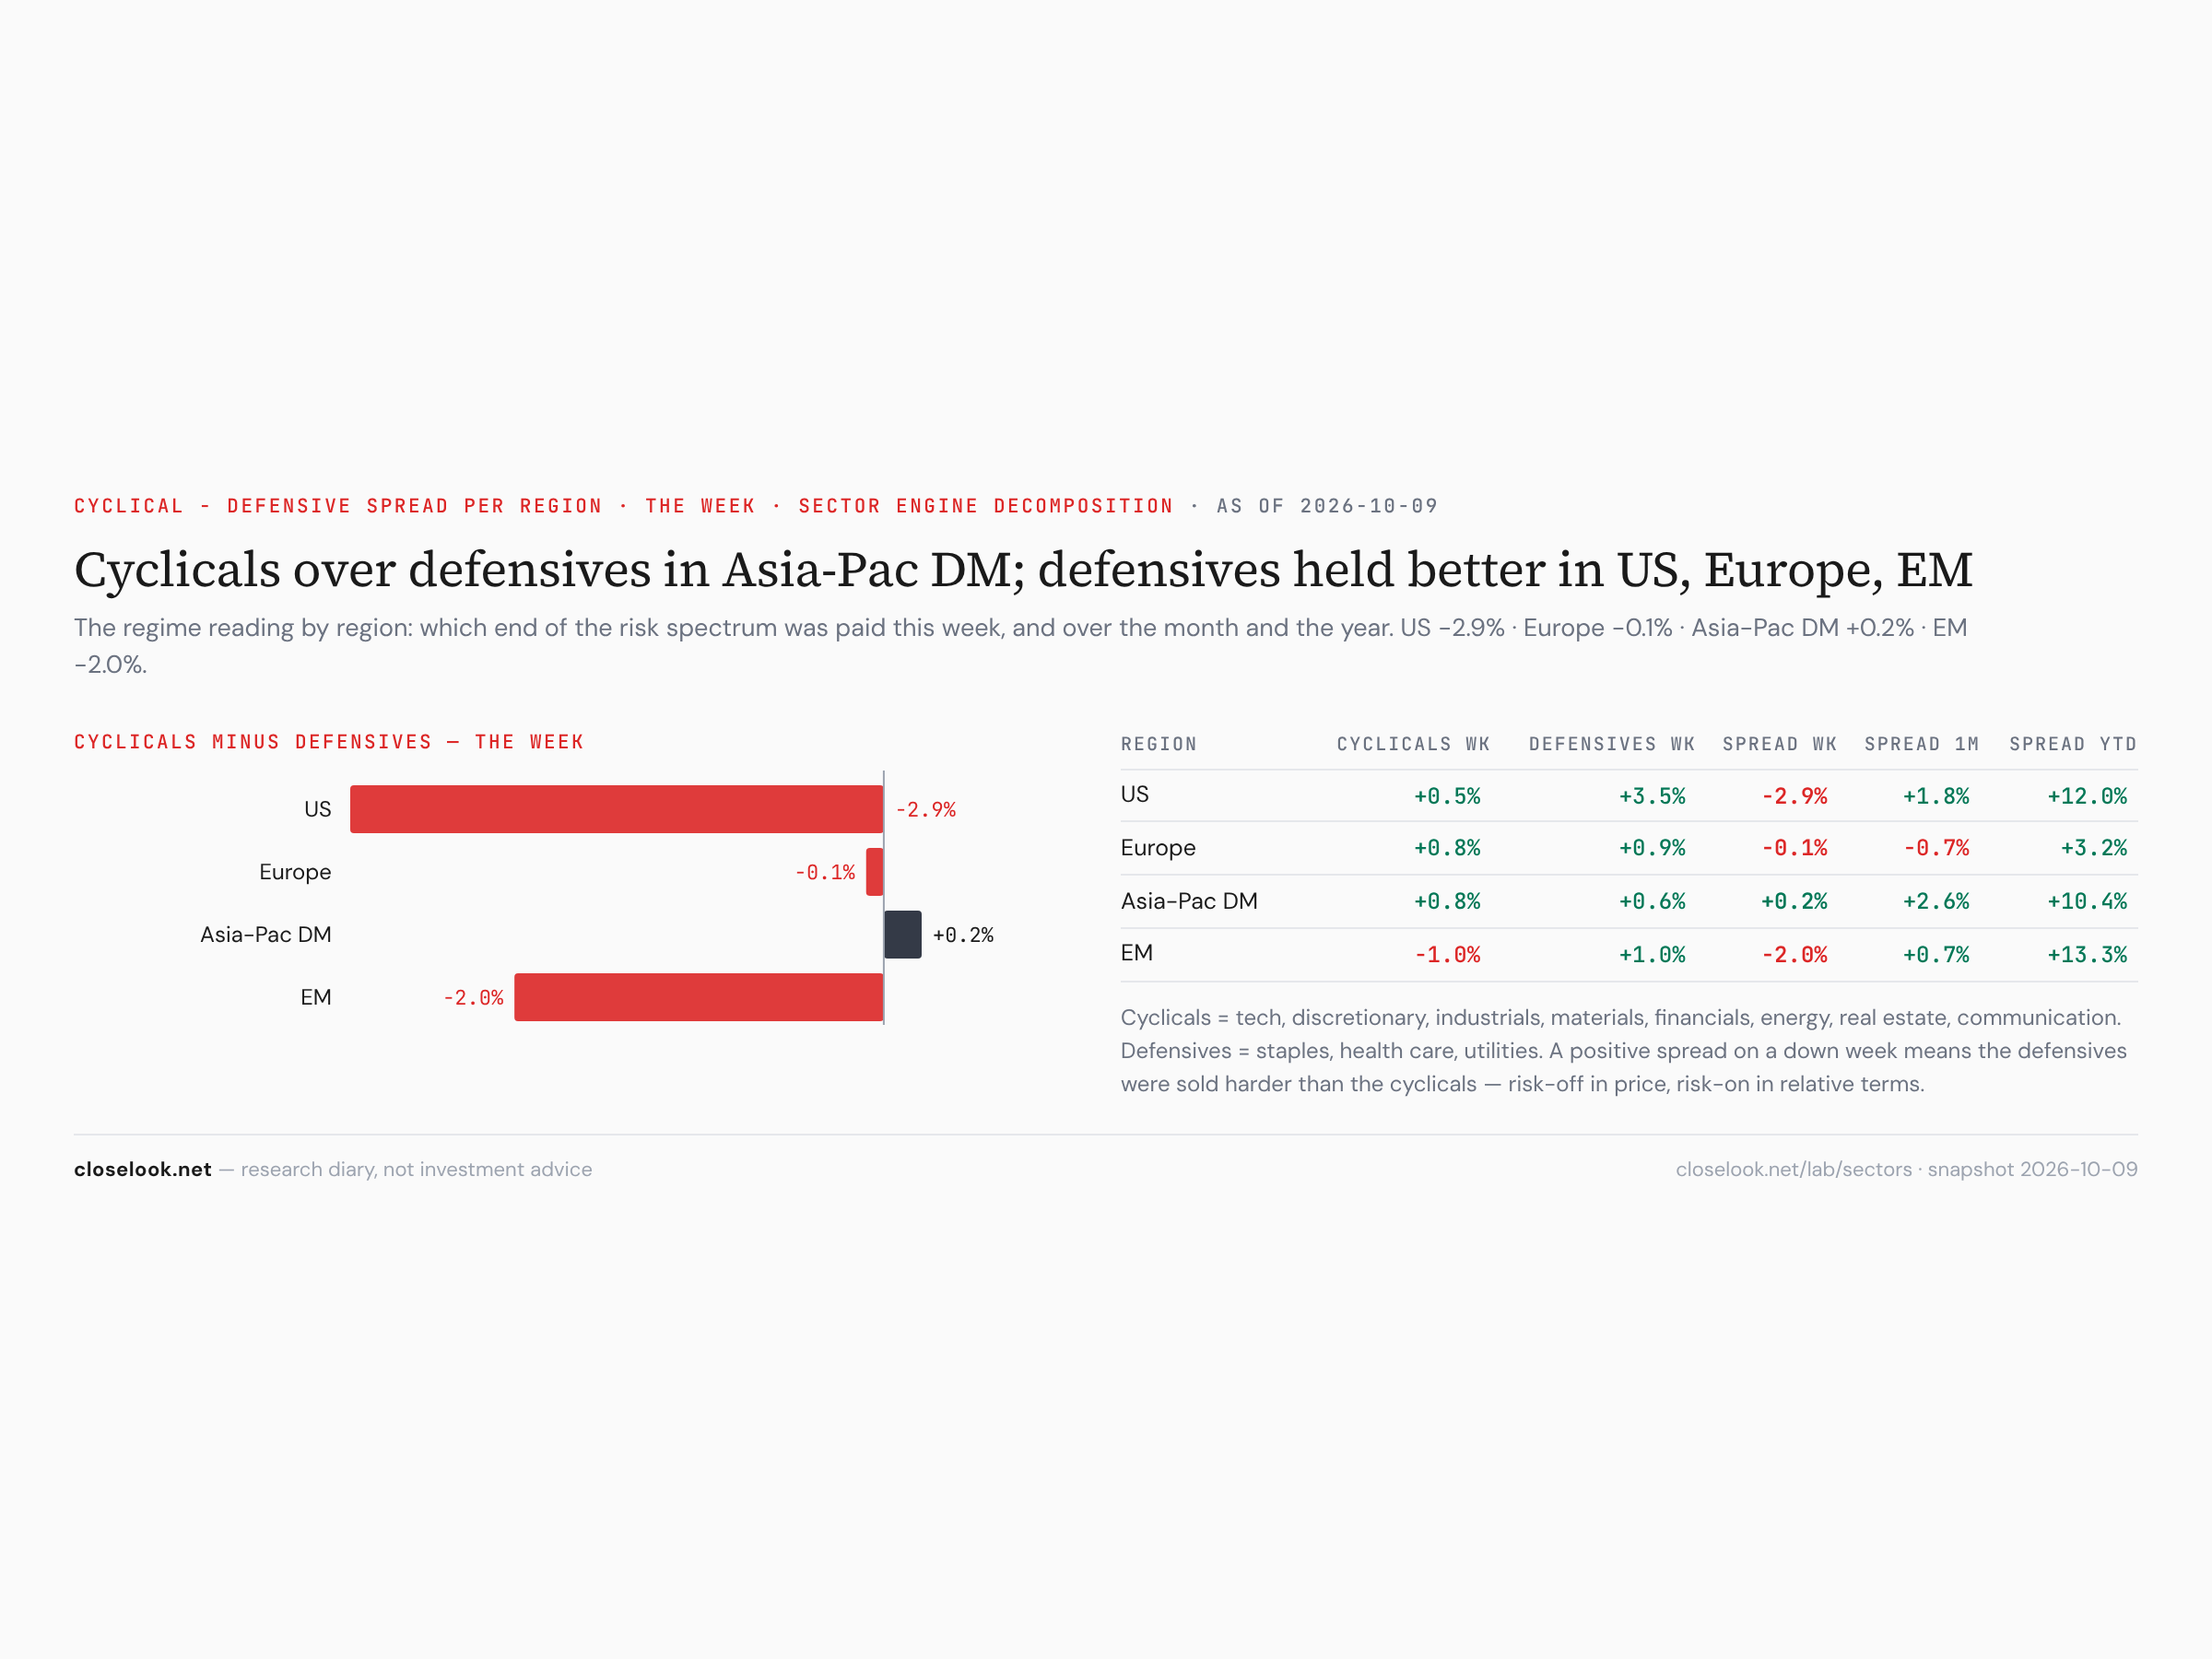
Sectors: defensives over cyclicals in America. The engine's cyclical-minus-defensive spread was −2.9 points in the US (cyclicals +0.5%, defensives +3.5%), −2.0 in emerging markets, −0.1 in Europe and +0.2 in developed Asia. On the year the US spread is still +12.0 points. One week of defensives does not undo a year of cyclicals; it does show where the money went when the chips fell.
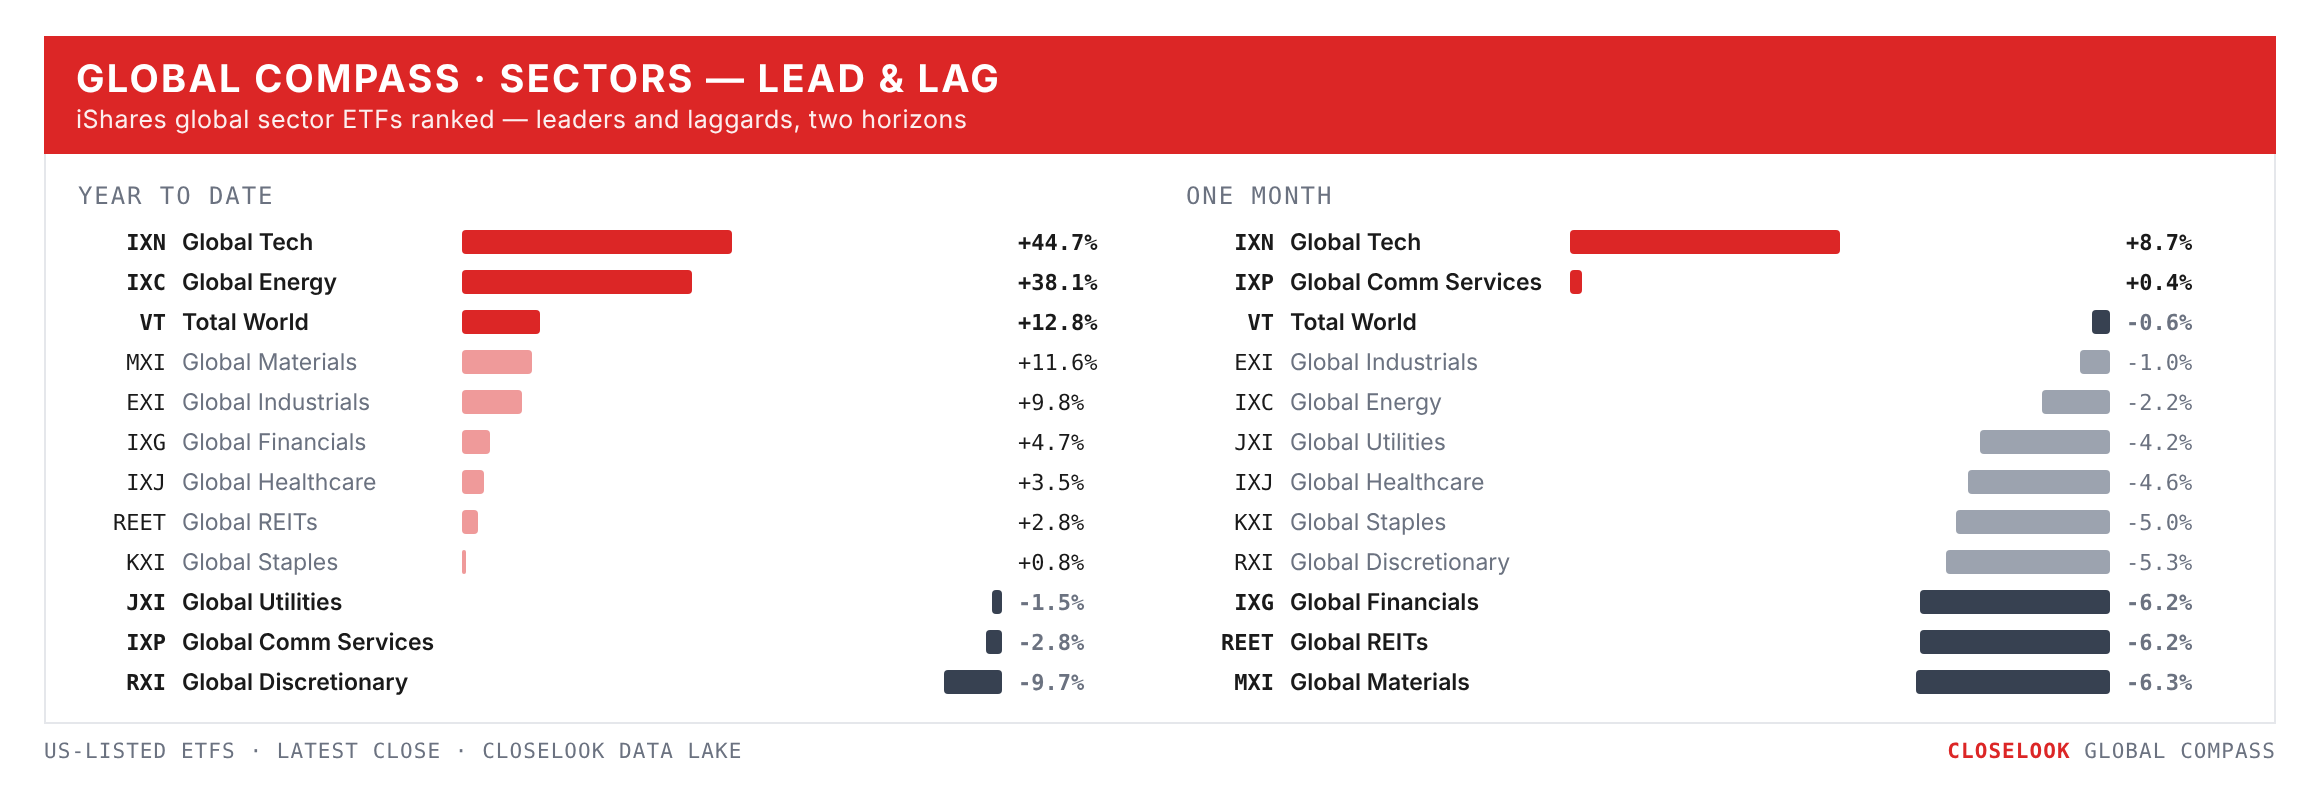
Sectors: the leaders' bench. Technology 149.84, ten cents above its line after a record close of 152.94 on Tuesday. Industrials 189.76, 8.3% under August. Financials 127.56, 6.9% under the September 3 record, five weeks under its line. Materials 109.08, 7.9% under the August 25 record, seven weeks under the February line.
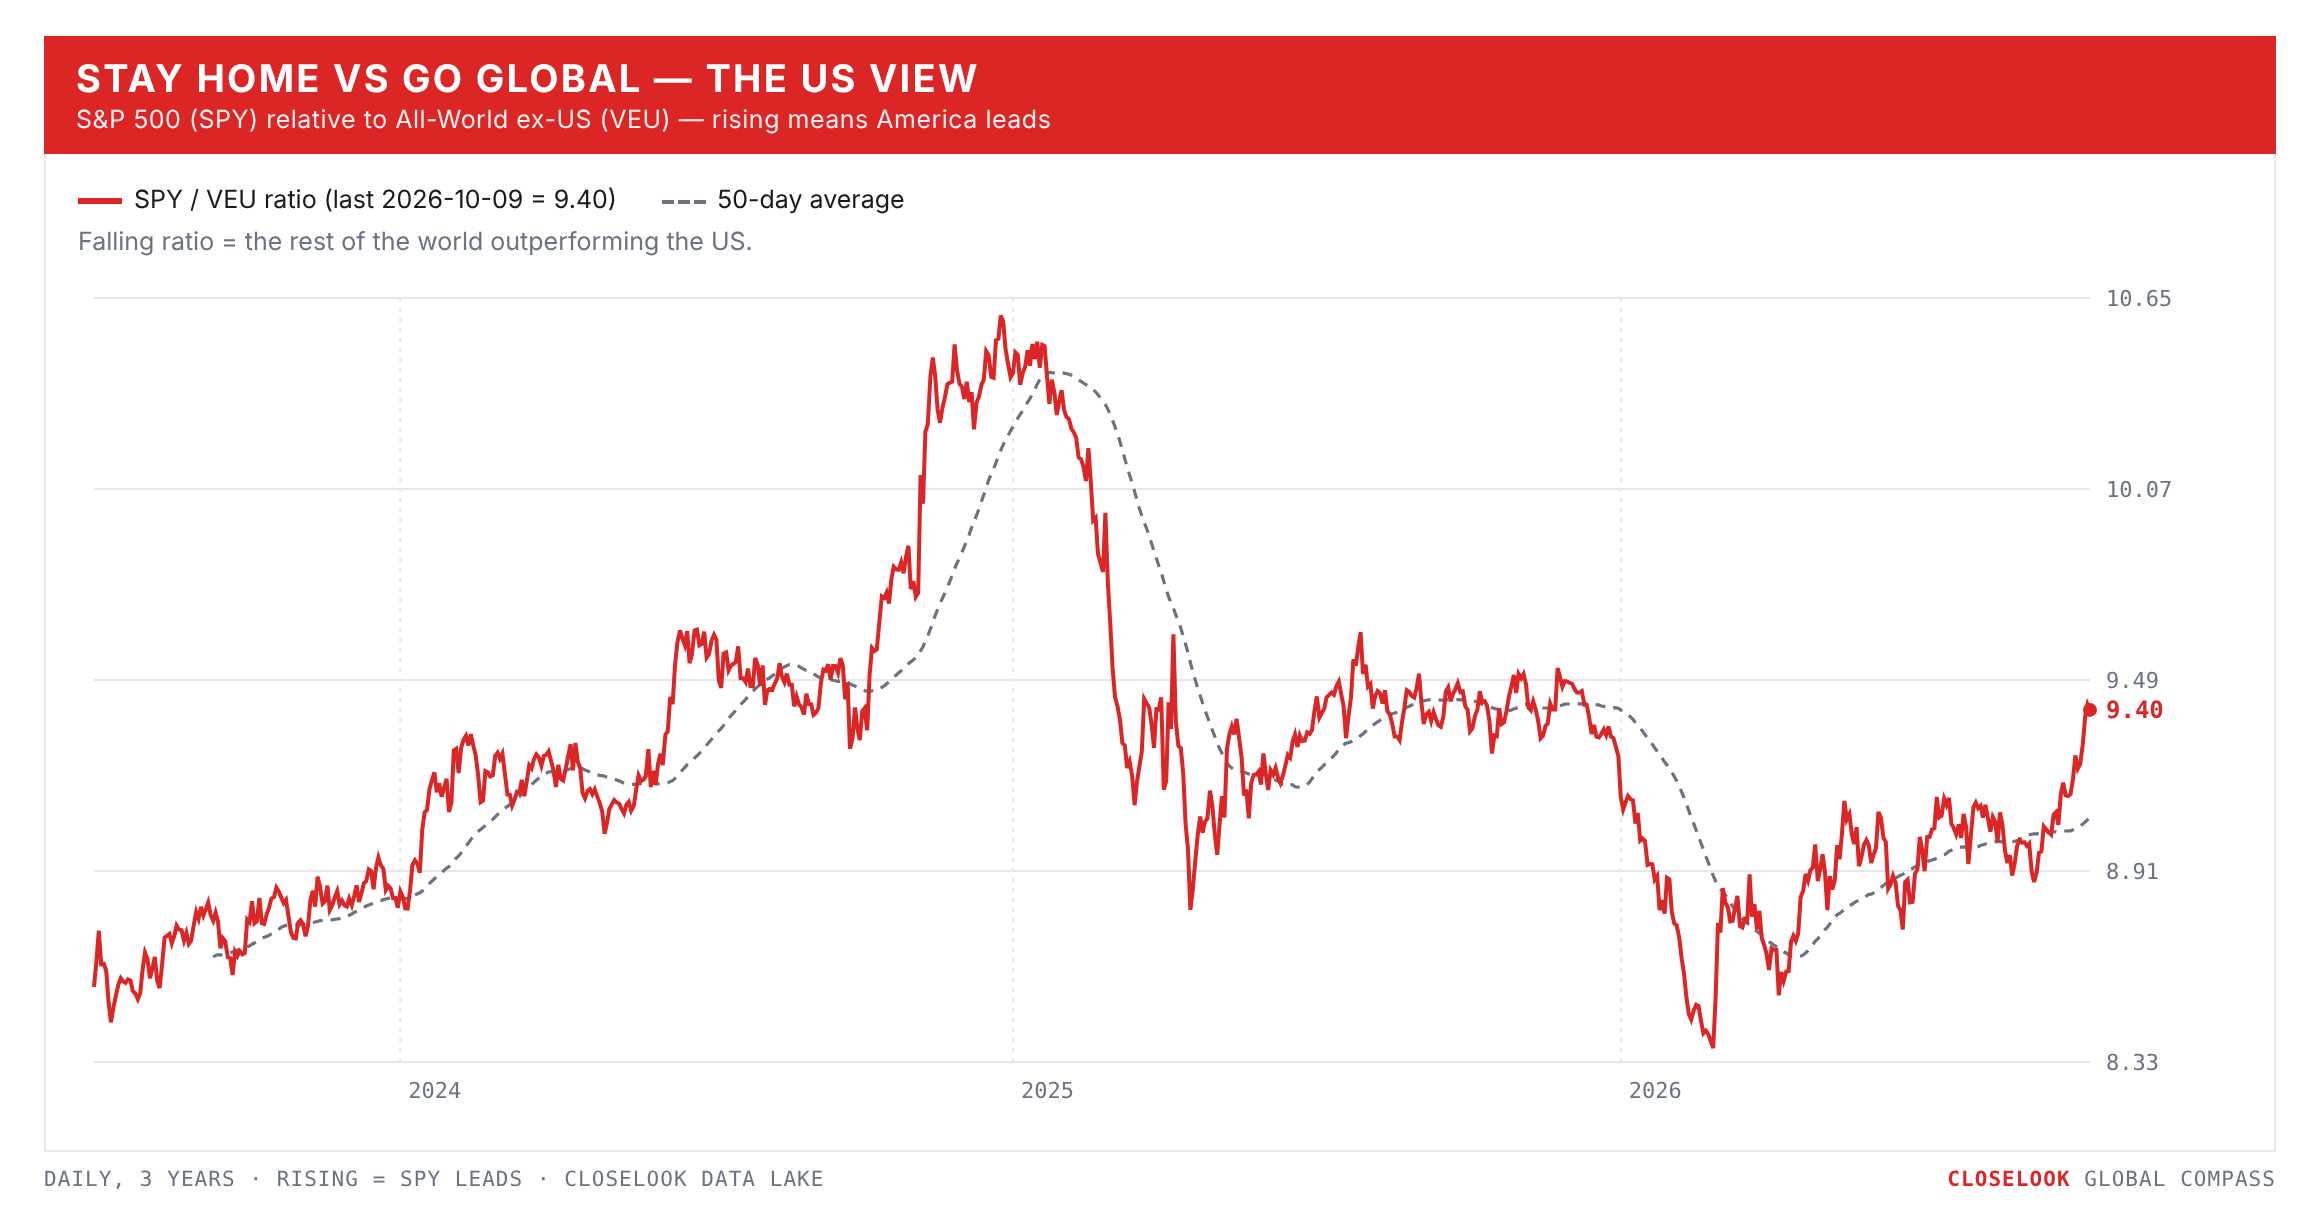
Stay home vs go global — the US view. America won a fifth week: SPY +1.16%, VT +0.44%, VEU −0.75%. And now the year: +14.2% against +13.3% against +12.6%. Five weeks ago the world ex-US led by 4.5 points; today it trails by 1.6. The SPY/VEU ratio on the chart below has turned up from its September low and kept going.
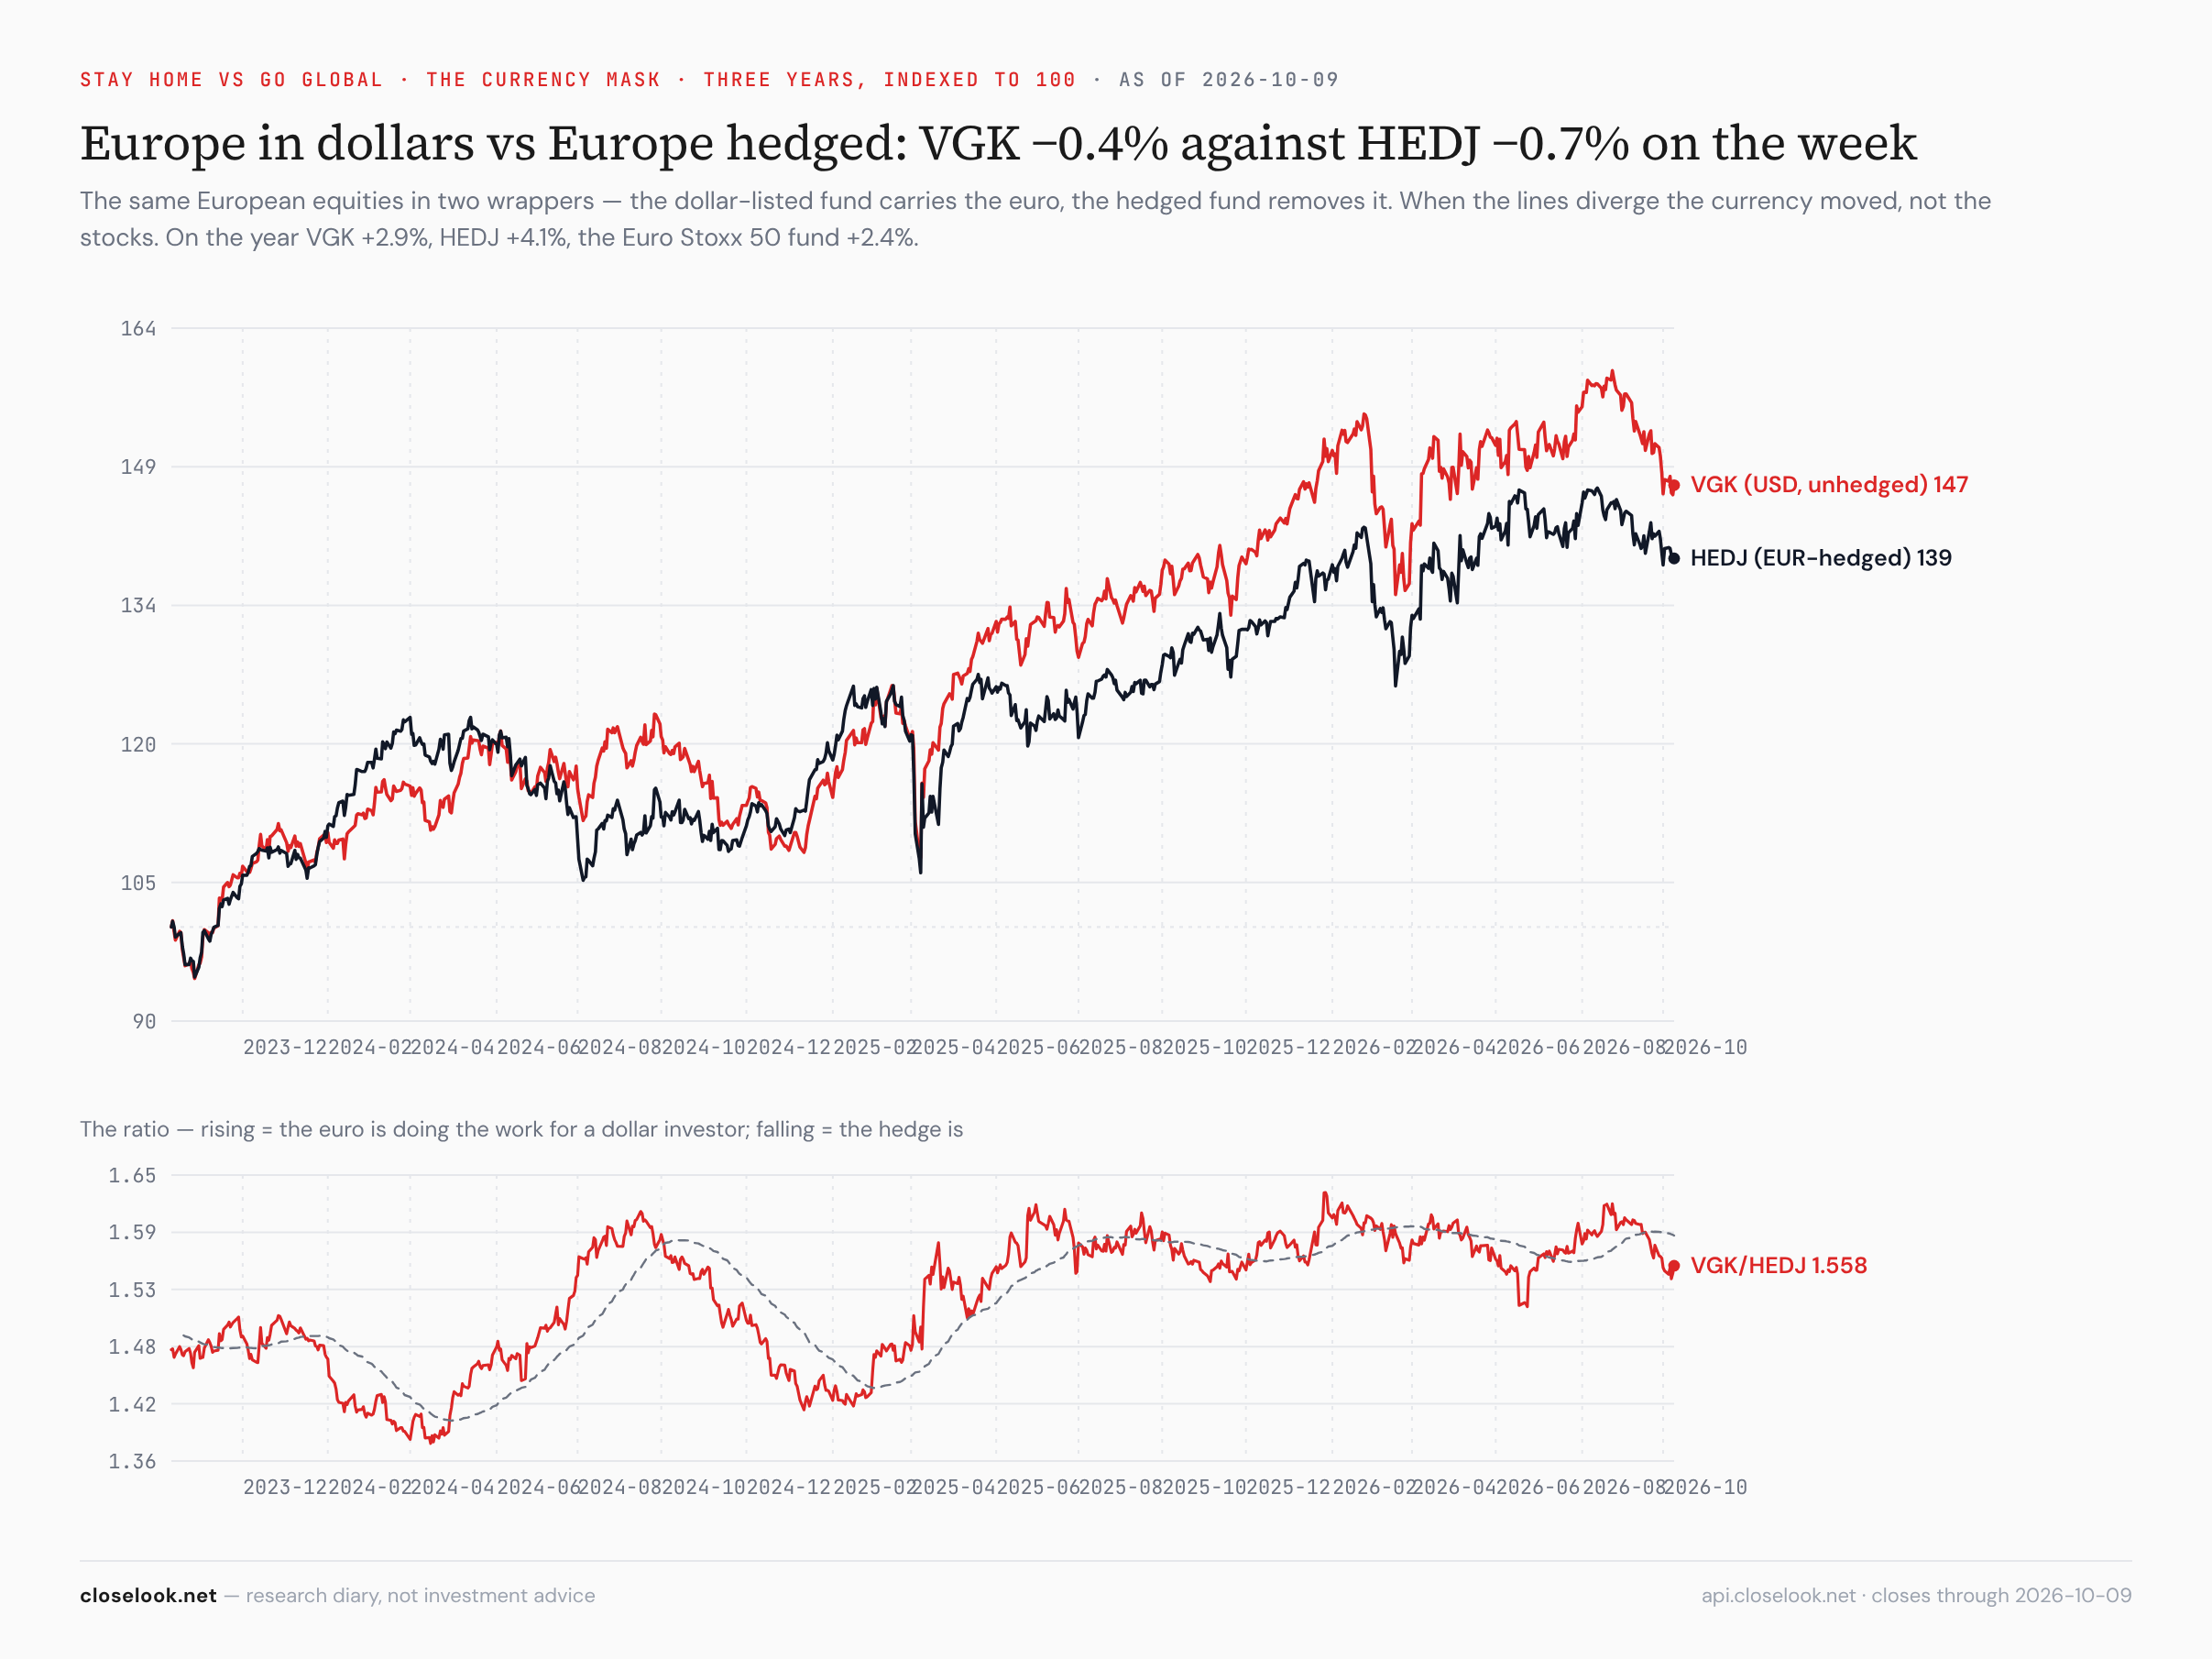
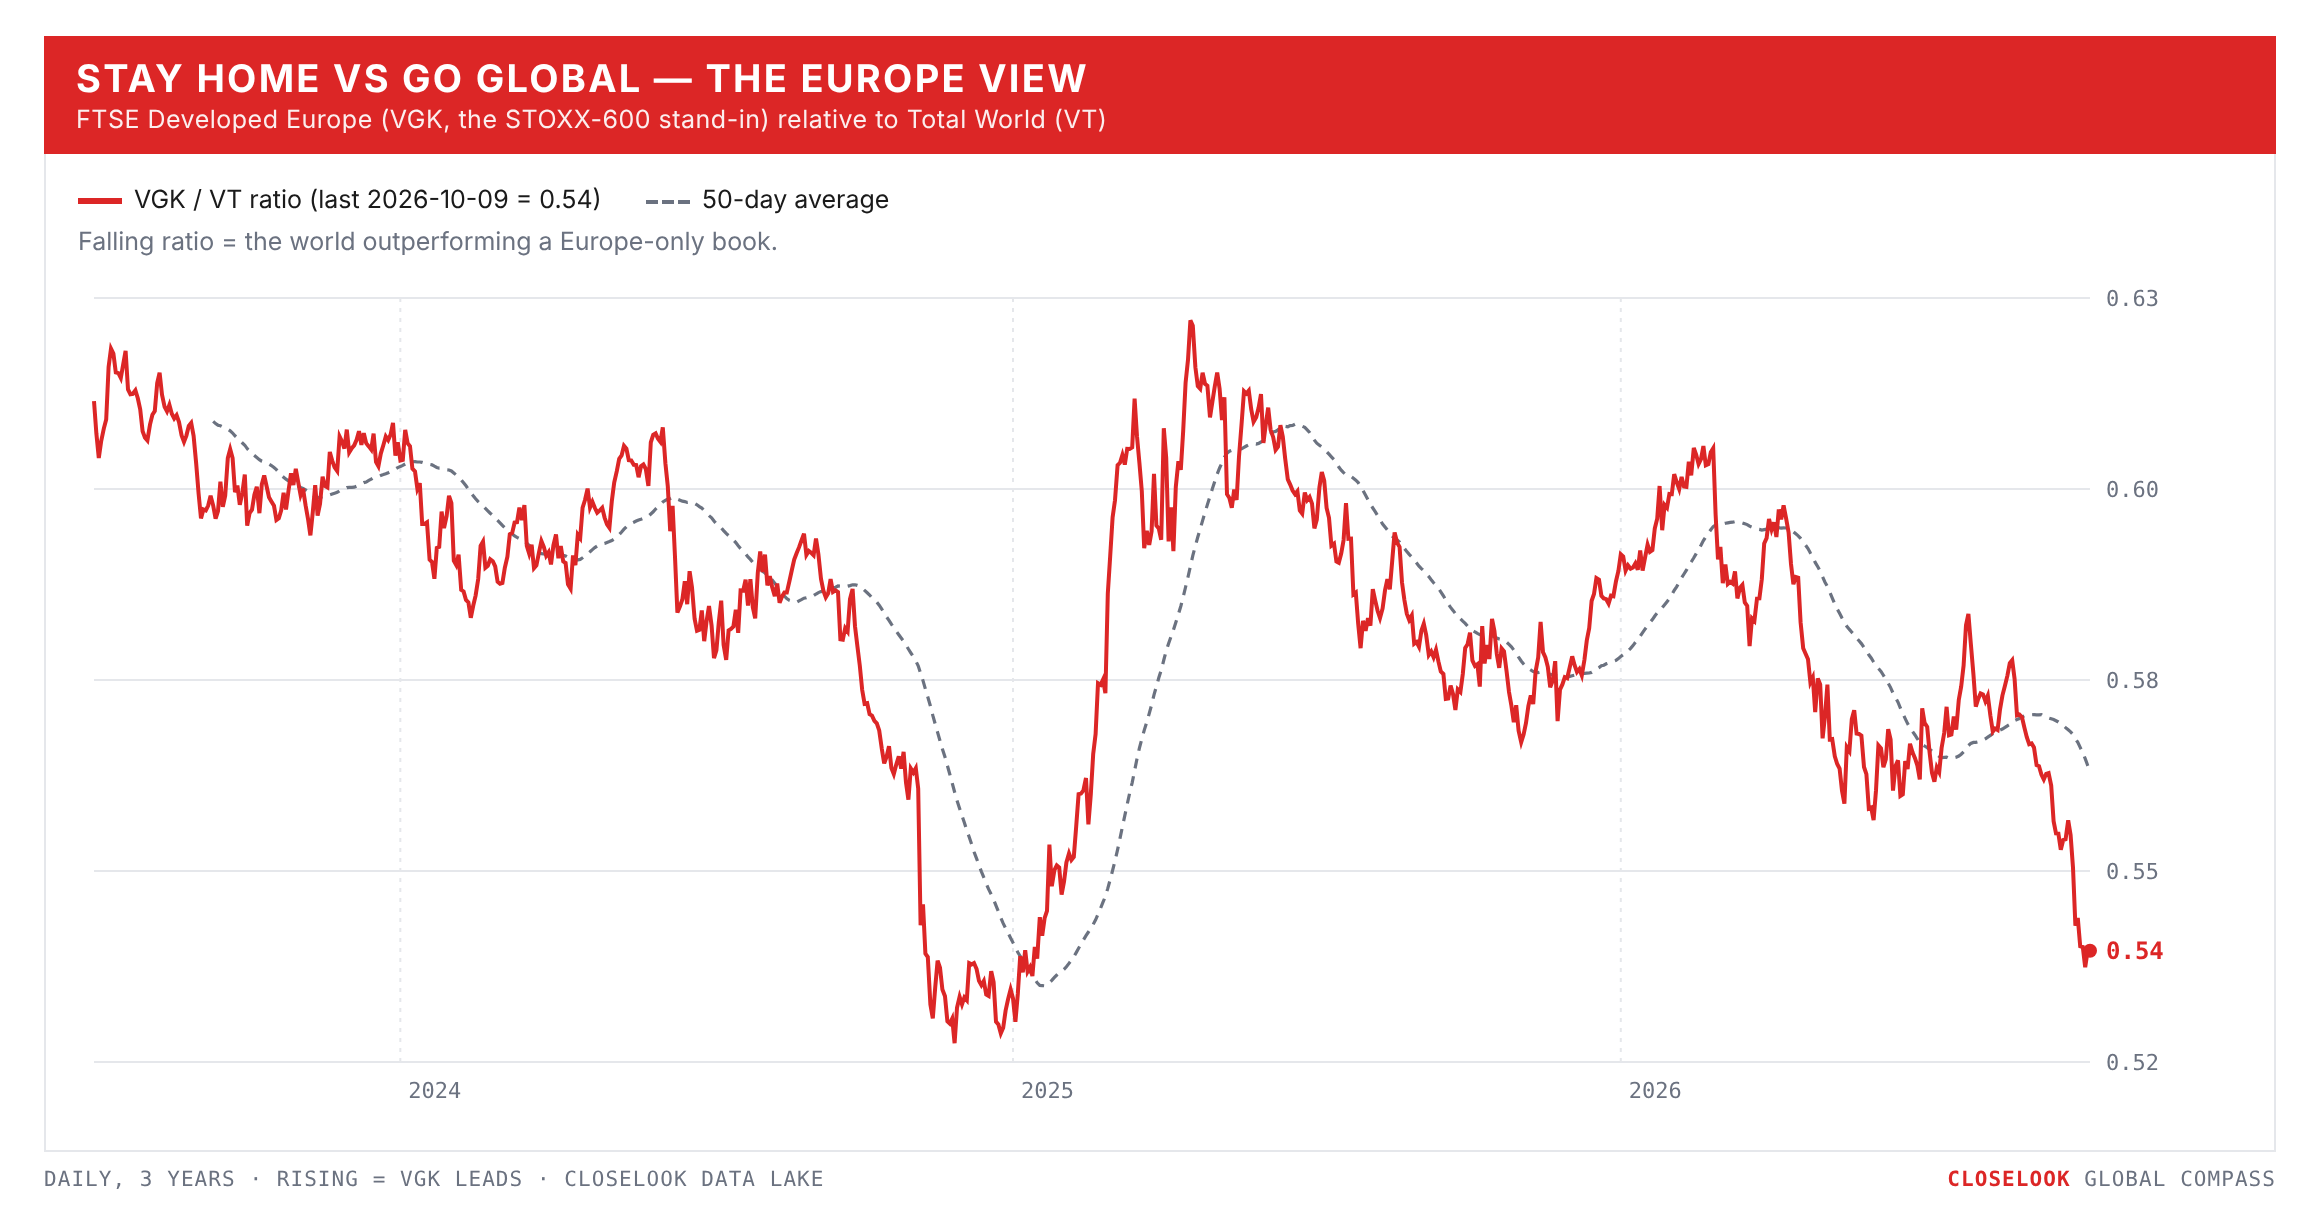
Stay home vs go global — the Europe view: the core down, the edges up. In local terms: the STOXX 600 flat (+0.03%), the Euro Stoxx 50 −1.04%, the DAX −0.57% to 25,087, the CAC −1.33% to 7,792, Spain's IBEX −0.27% — and outside the euro the FTSE 100 +0.86% to 10,552 and Switzerland's SMI +0.93%. The dollar-listed Europe fund fell 0.41%, the euro-hedged one 0.74% — the hedged fund holds the euro area's exporters, the unhedged one also holds Britain and Switzerland, which rose. The French fund closed Thursday at 41.32, its lowest close in a year.
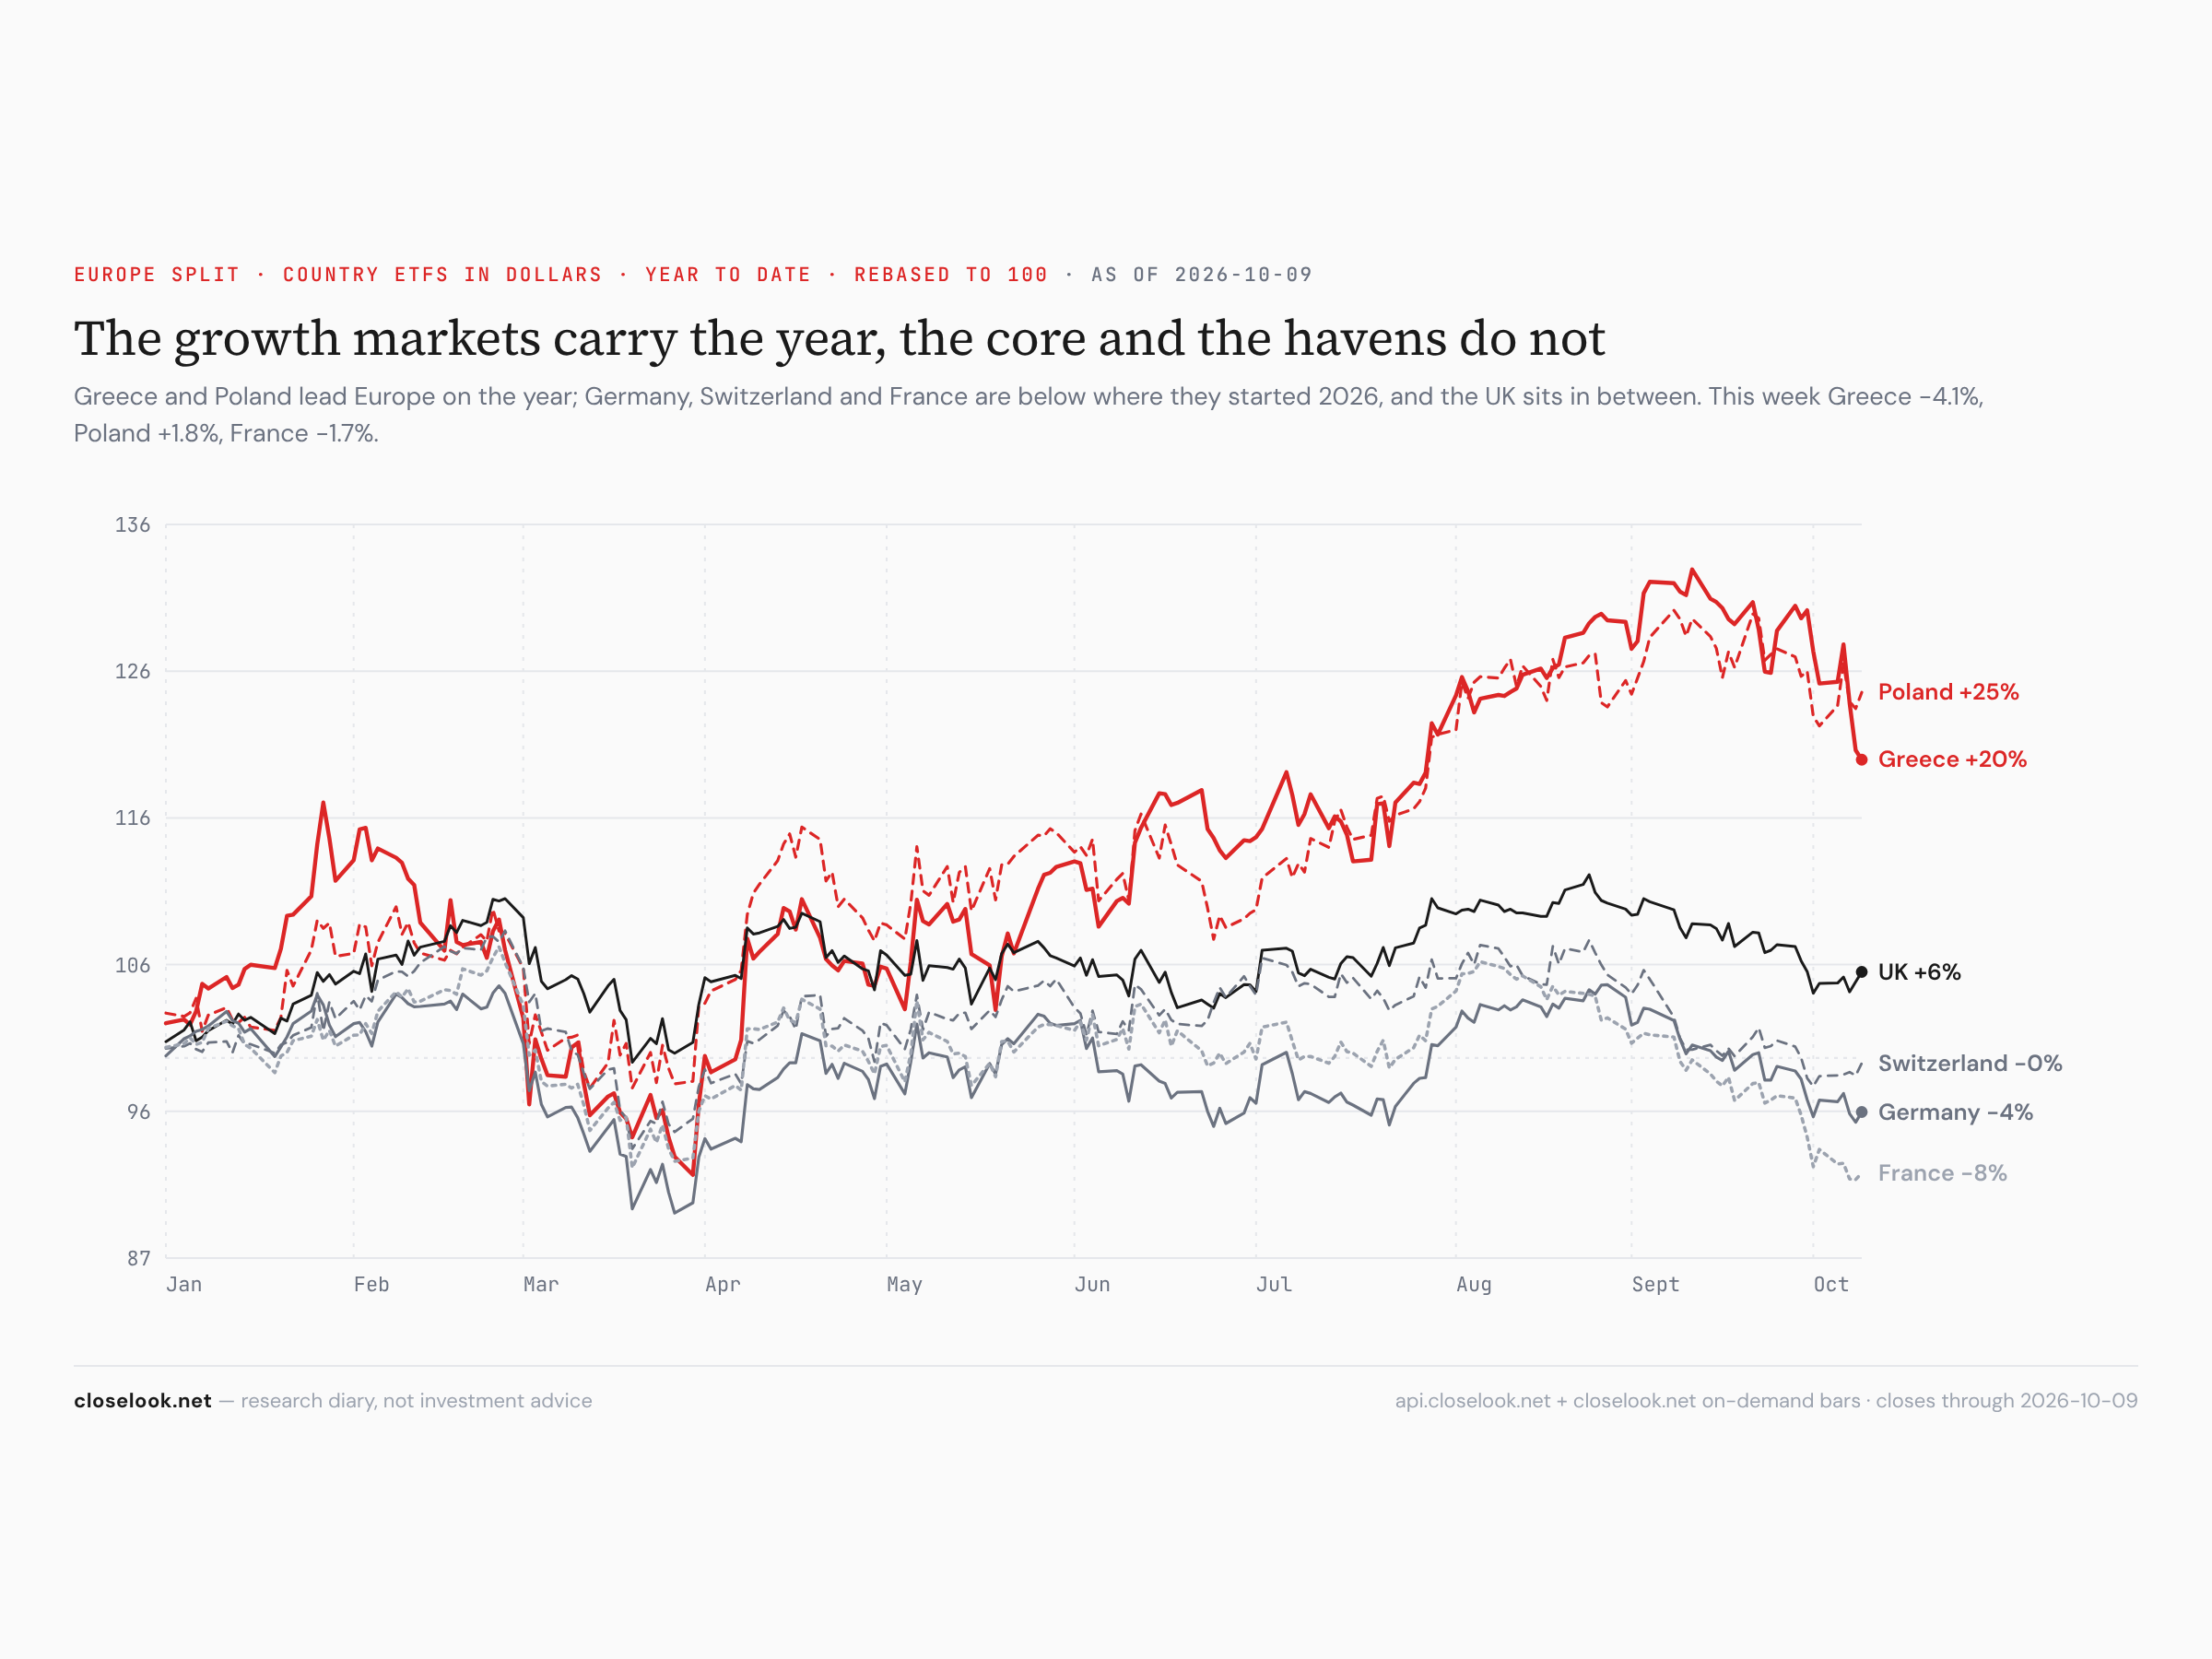
Europe split — the growth markets held. Poland +1.8%, Britain +0.7%, Switzerland +0.9% — against the Netherlands −1.8%, France −1.7%, Austria −3.1%. The Netherlands and Austria are Europe's chip-equipment and supplier markets, and they fell with the chips; the euro core fell with the euro. Last week both growth markets fell harder than the core; this week Poland rose against it. On the year: Poland +24.5%, the Netherlands +16.9%, Austria +14.1%, Britain +5.8%, Switzerland −0.4%, Germany −3.6%, France −7.7%.
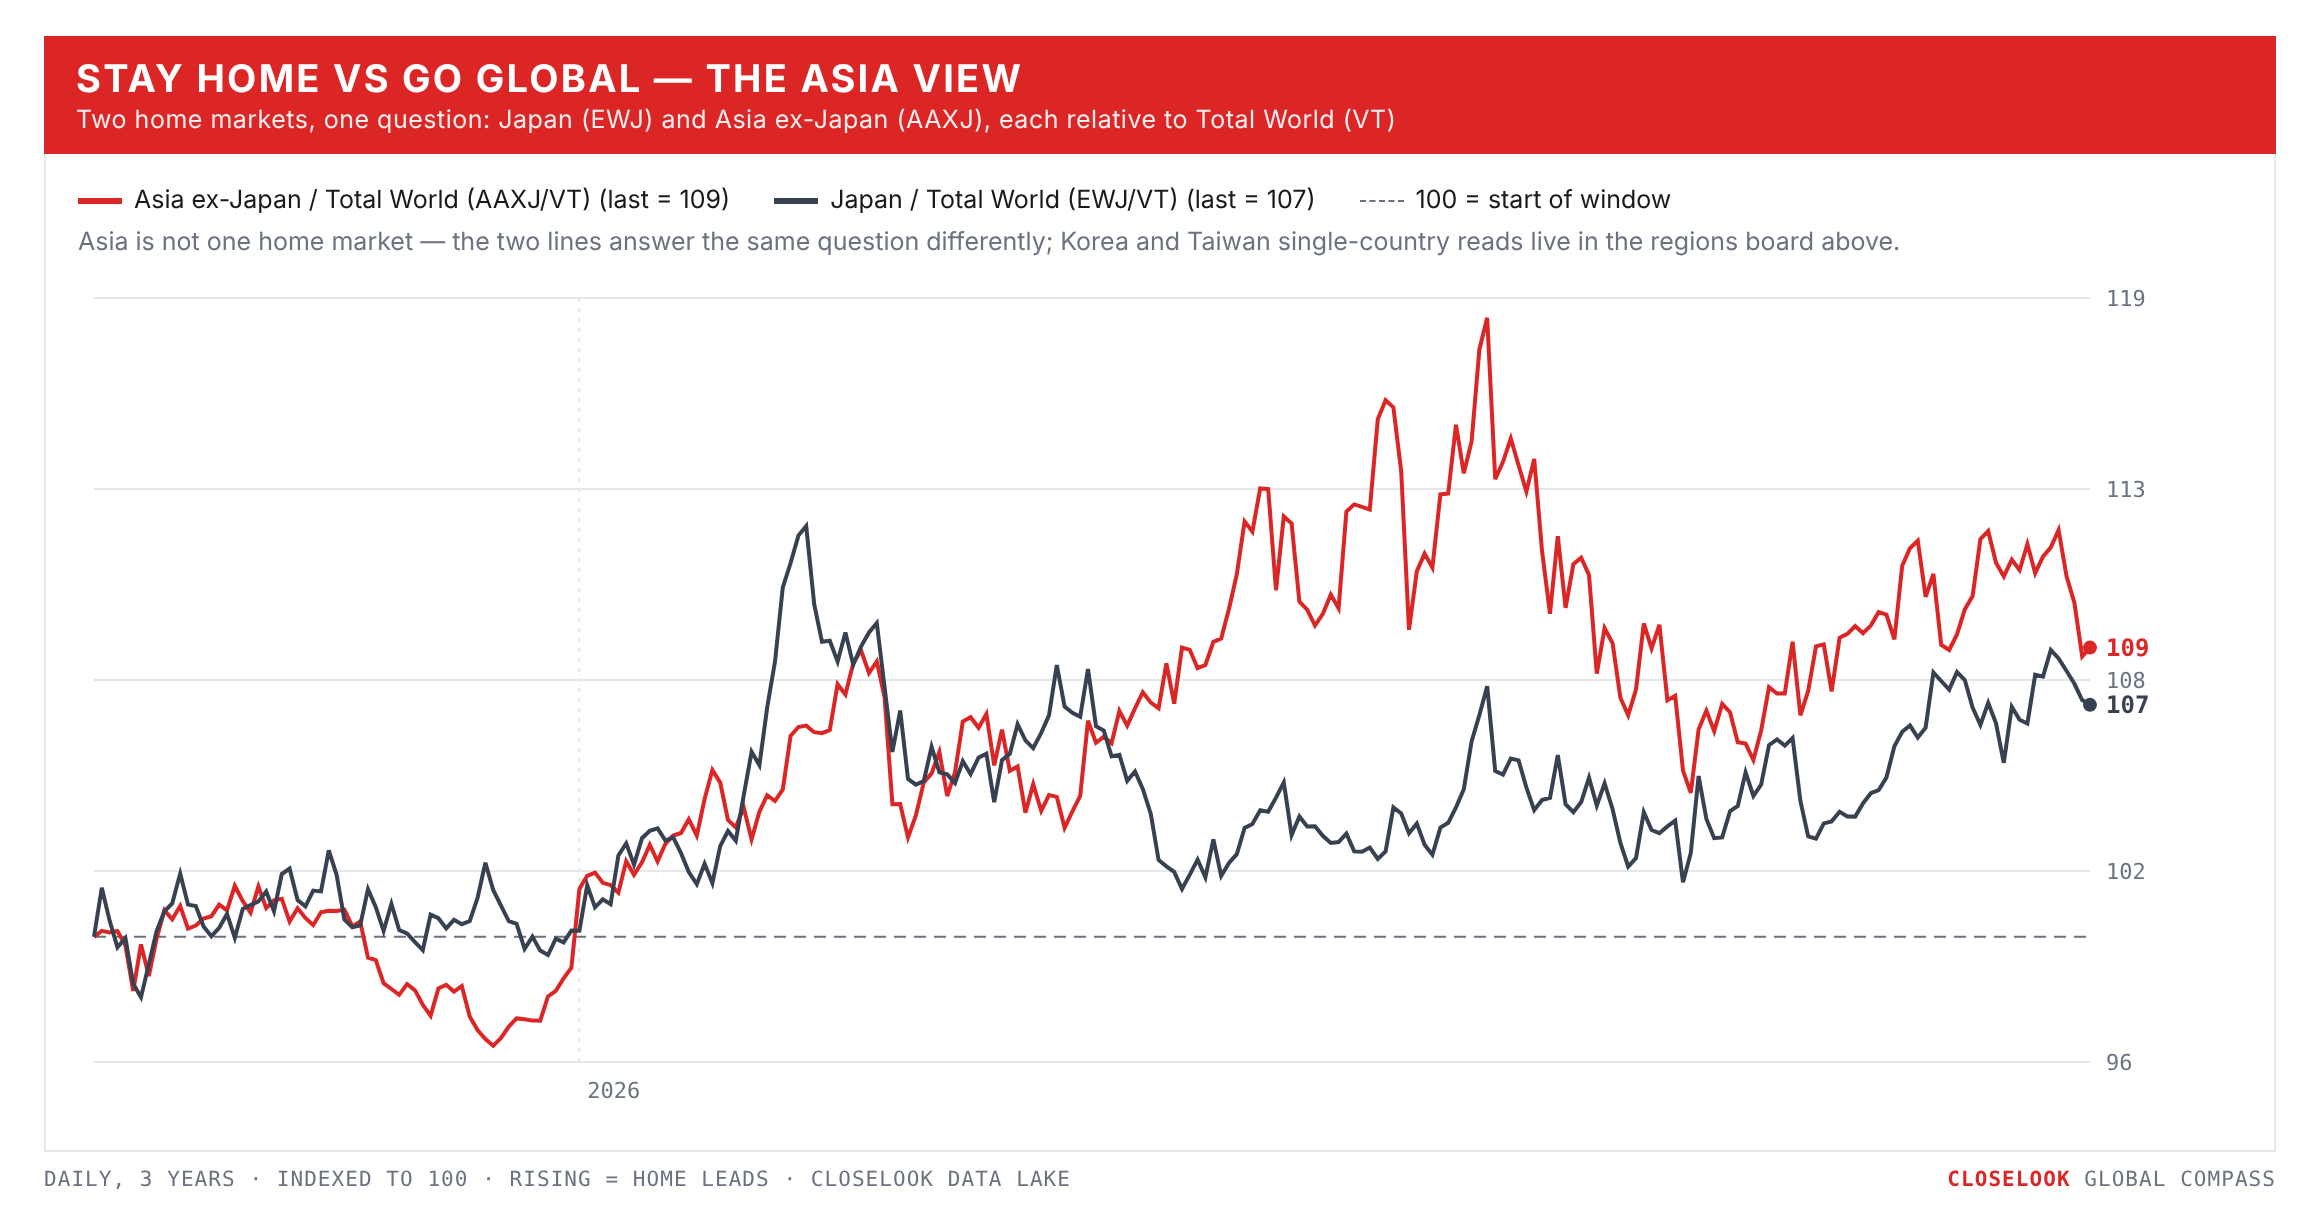
Stay home vs go global — the Asia view: the corridor fell, the rest held. Korea: EWY −7.63%; the Kospi −5.4% to 6,626 by Thursday, the tech-heavy Kosdaq −0.1%. Taiwan: EWT −1.74% after Monday's record; the Taiex +1.7% to 49,313 by Thursday, after a record 49,823 on Tuesday — the local market up, the dollar fund down, because the fund traded a Friday on which Taipei was shut. Japan: the Nikkei +1.06% to 69,031, the TOPIX +0.34%, the dollar fund −1.07% as the yen weakened. India: the Sensex +0.78% to 72,472, after 71,593 on Thursday — another lowest close in a year — the dollar fund −1.05%. Hong Kong's Hang Seng rose 1.0%.
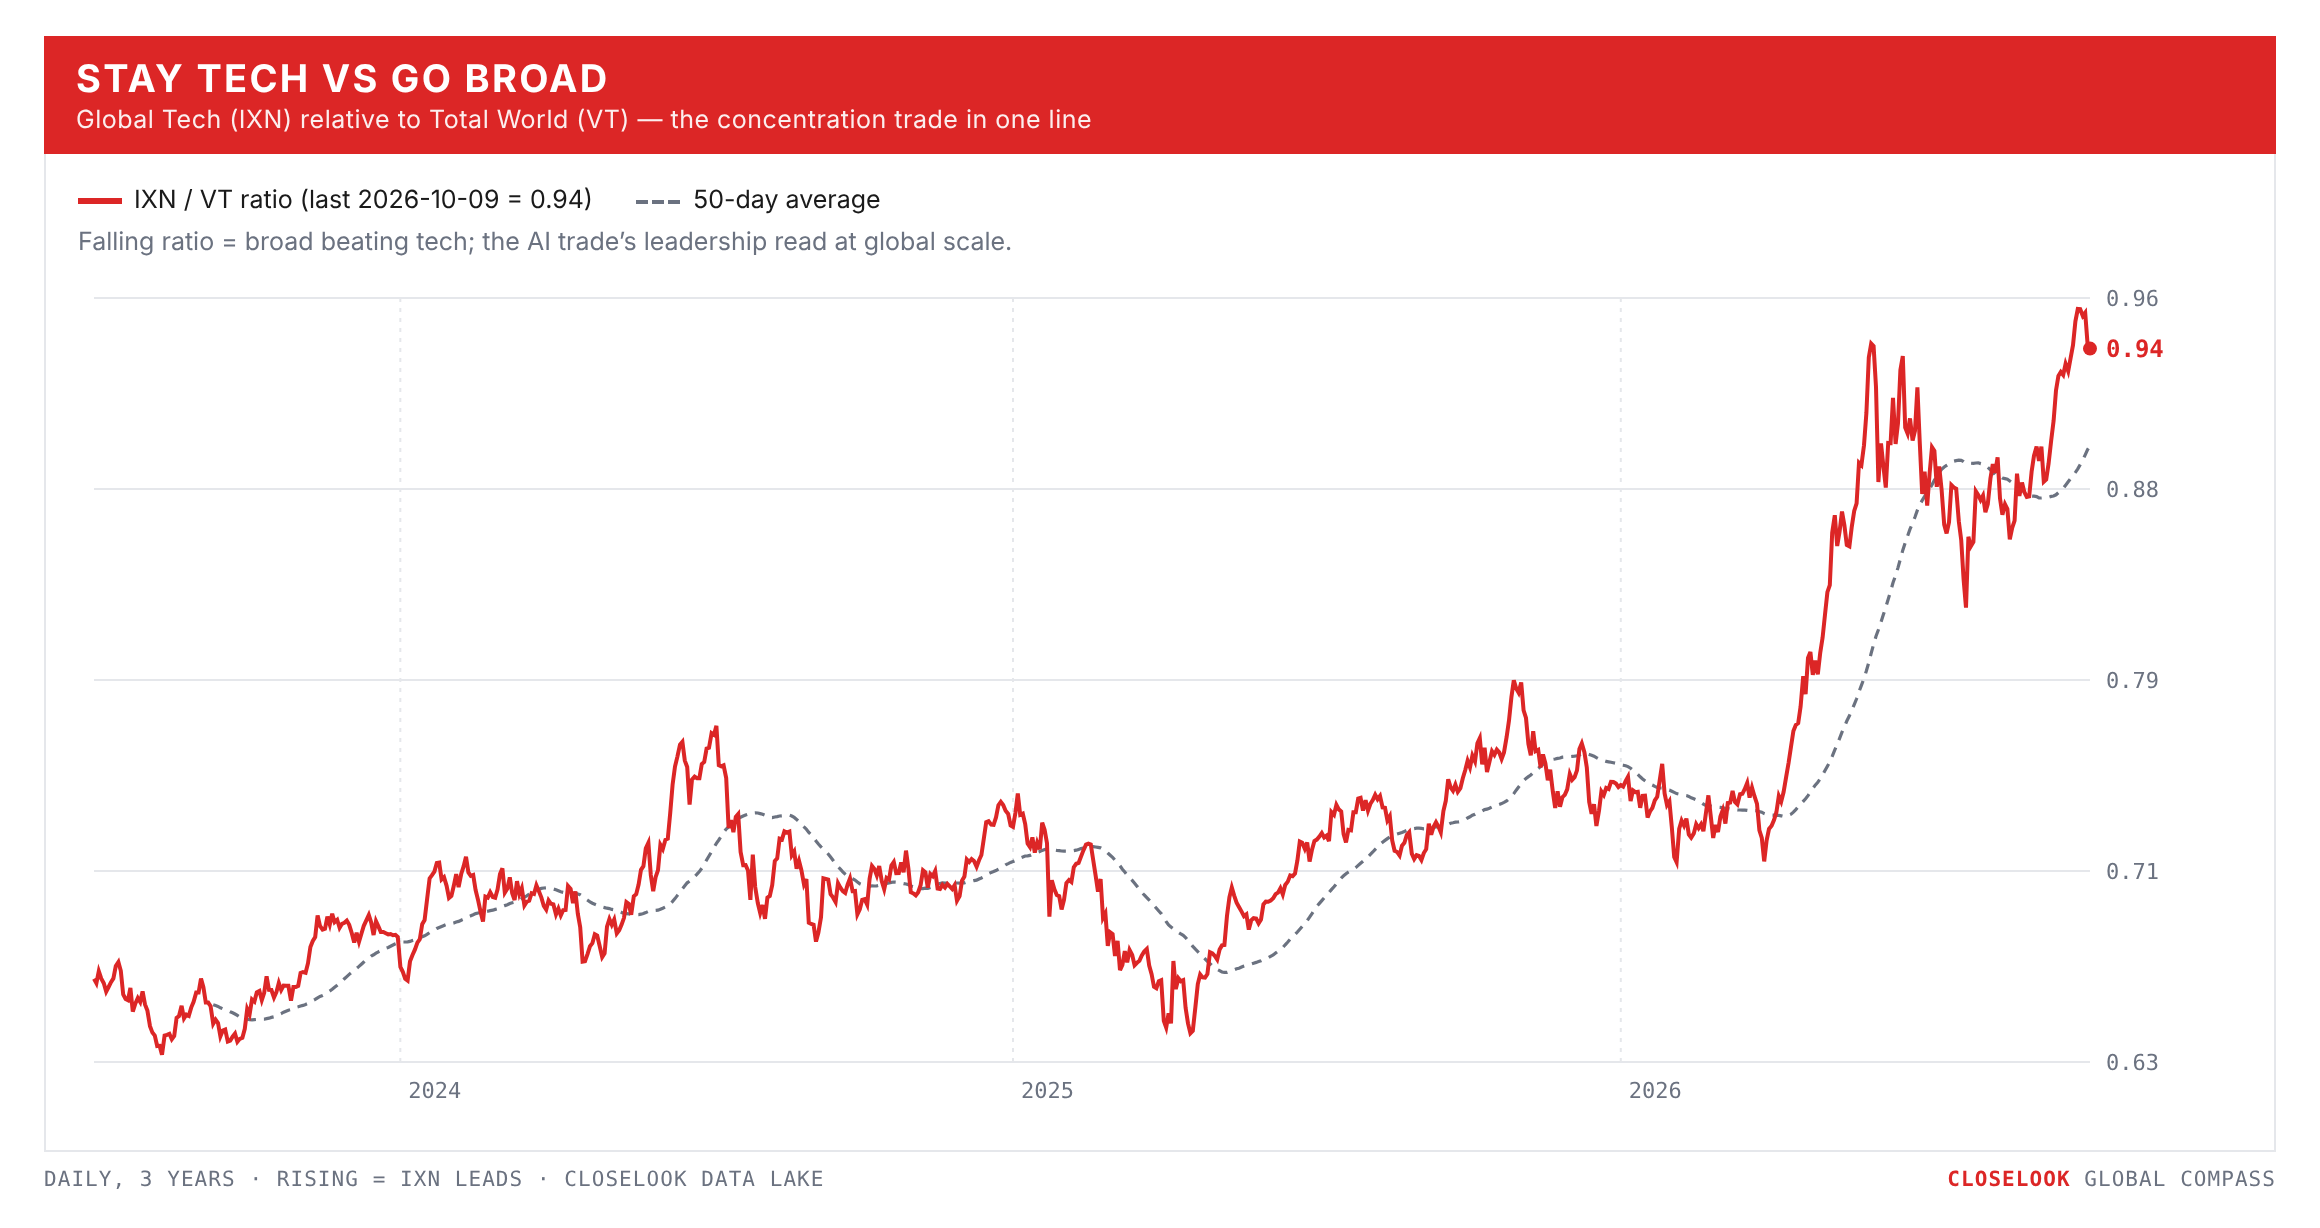
Stay tech vs go broad. This week broad won. The equal-weight S&P +1.58% against the S&P's +1.16% and the Nasdaq 100's +0.23%; the world +0.44% against global tech's −1.38%. On the year tech still leads by a distance — global tech +42.7% against the world's +13.3%.
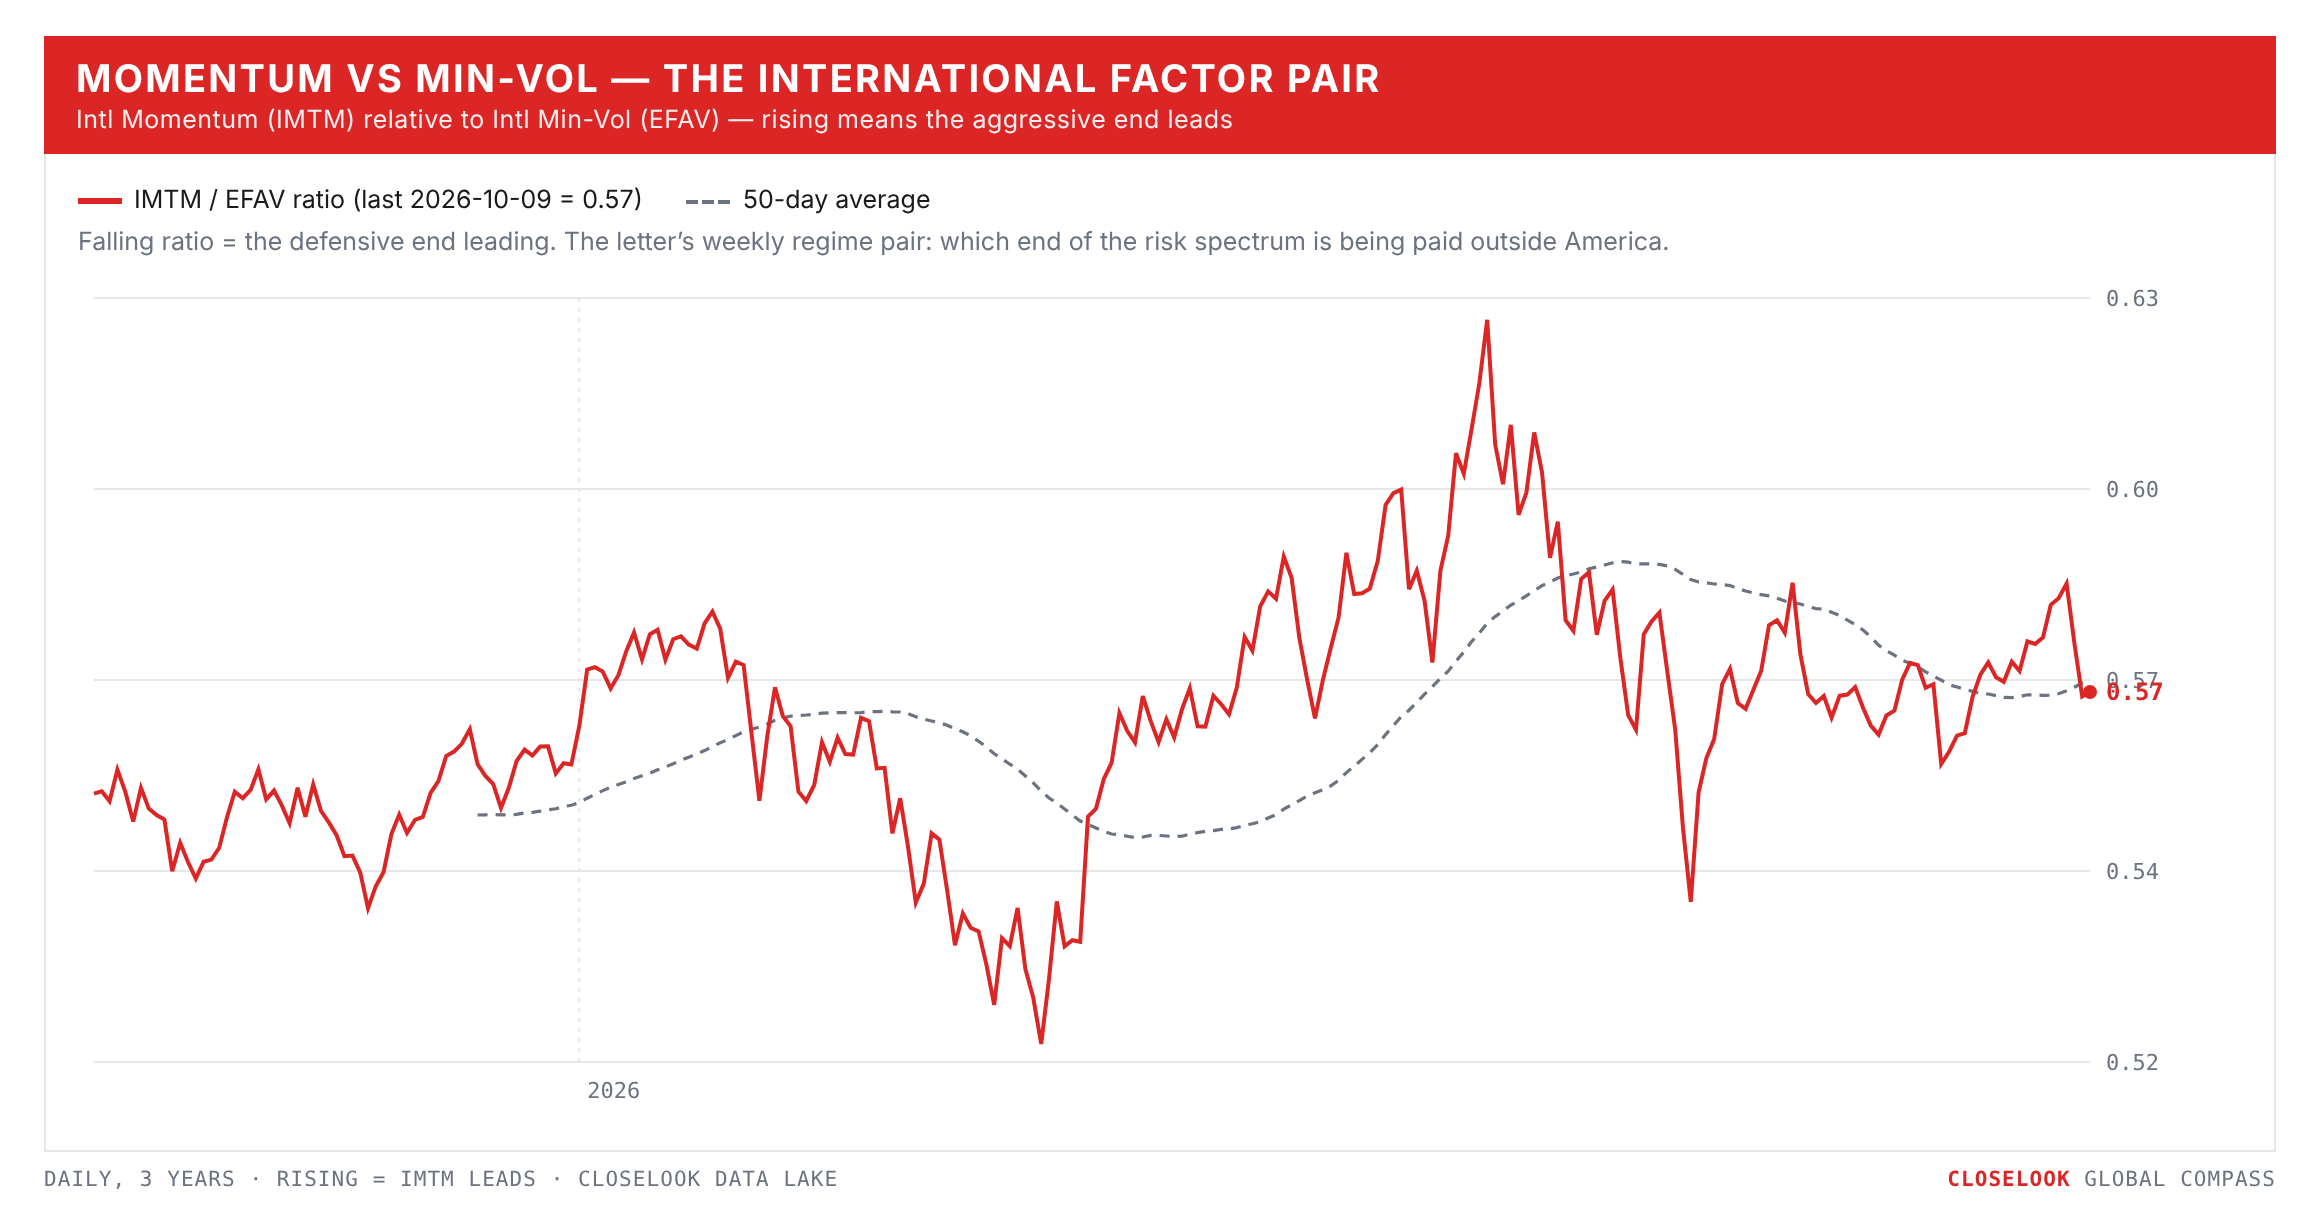
Momentum vs defensive — defensive, clearly. International momentum fell 1.41% to 52.30; international min-vol rose 0.75% to 91.64; global min-vol +1.56%. On the year momentum still leads, +9.0% against +6.3%. Momentum outside America is heavy in the chip exporters; min-vol is staples, utilities and health care — the week in one pair.
One more pair: value edged growth. EAFE value −0.38% against growth −0.64%. On the year value leads +9.5% against +5.6%.
The Closelook letters — where this one sits. The house thesis, compressed: the stock market is a growing system at the aggregate level in which most constituents slowly fade while a small group massively outperforms — and that group changes dynamically; it never stays static. Own the aggregate, know the current winner group, watch for the rotation. This week showed a rotation inside the winner group, not out of it: from the AI builders to the AI sellers, from the chip countries to the market that sells software. This letter reads the map (regions, currencies, rates); Sunday's US letter reads the tape and its levels; Sunday evening's Hypergrowth letter reads the names.
2 · The State
The mechanism, named: the AI money moved up the stack. Put the week in order. Monday: Brazil's fund +12.5% on its election; Asia bought the chip makers on Friday's weak jobs report — Tokyo Electron +5.0%, TSMC +2.6%; the euro fell on talk of an early Spanish election. Tuesday: the S&P 500 at a record, Marvell +7.6% on its investor day, AMD at a record; the chip-machine makers fell, and so did the storage makers — Seagate −9.2%, Western Digital −6.9%; Seoul sold its memory makers. Wednesday: small caps −1.3%, the power and cooling suppliers to AI data centres sold; the Fed's September minutes pointed to another rate hike by year-end. Thursday: Brent rose to 103 dollars; then the OpenAI revenue report — about 50 billion dollars, not 70 — and the chip index fell 3.4%, Broadcom −4.4%, Micron −4.8%, CoreWeave −7.8%, while Atlassian, Adobe and Snowflake rose; TSMC's September sales, the same day, rose 54.6% on the year. Friday: the cloud fund rose for a second day, Zscaler +6.4%, Datadog +5.7%; Delta cut its outlook on jet fuel.
The AI trade did not end this week. It changed address. The question the market asked on Thursday was whether the buyers of chips will earn enough to keep buying them; on Friday it answered by buying the companies that sell AI to everyone else.
TSMC — the test this letter set, and what it said. Last week this letter called TSMC's September sales the week's signal: a strong number confirms the corridor, a soft one is the first crack. The number was strong — NT$511.9 billion, 54.6% more than a year earlier, 0.6% less than August, and NT$1.49 trillion for the quarter, +51%. The corridor fell anyway. The read: the sales confirm that the build-out is still being paid for this quarter; the price says the market is now asking about next year. A strong number that does not lift the price is a market that had already paid for it — the same thing this letter wrote about Micron's record quarter a week ago.
Real yields — the highest since 2008. The yield that matters most for what a stock is worth is the real one: what a government pays above inflation. The ten-year Treasury real yield (the TIPS yield) closed at 2.95% on Monday — the highest since November 2008 — and 2.91% on Friday; the twenty-year was 3.17% and the thirty-year 3.32%. Between 2009 and late September 2026 it never closed at or above 2.90%. The financial-crisis spike reached 3.15% in November 2008, when the TIPS market itself was barely trading. Long-term US real yields are historically elevated, particularly by the standards of the past twenty years — not unprecedented over a longer record, but higher than at any point most of today's investors have managed money through.
High real yields are a headwind for valuations: they raise the rate at which future profits are discounted. They are not, on their own, a top or a bottom signal. What decides is the level, the direction and the reason — and this week the direction was flat (2.92% a week ago, 2.91% now) while the earnings that the AI trade depends on were questioned for the first time. §7 sets out the four combinations.
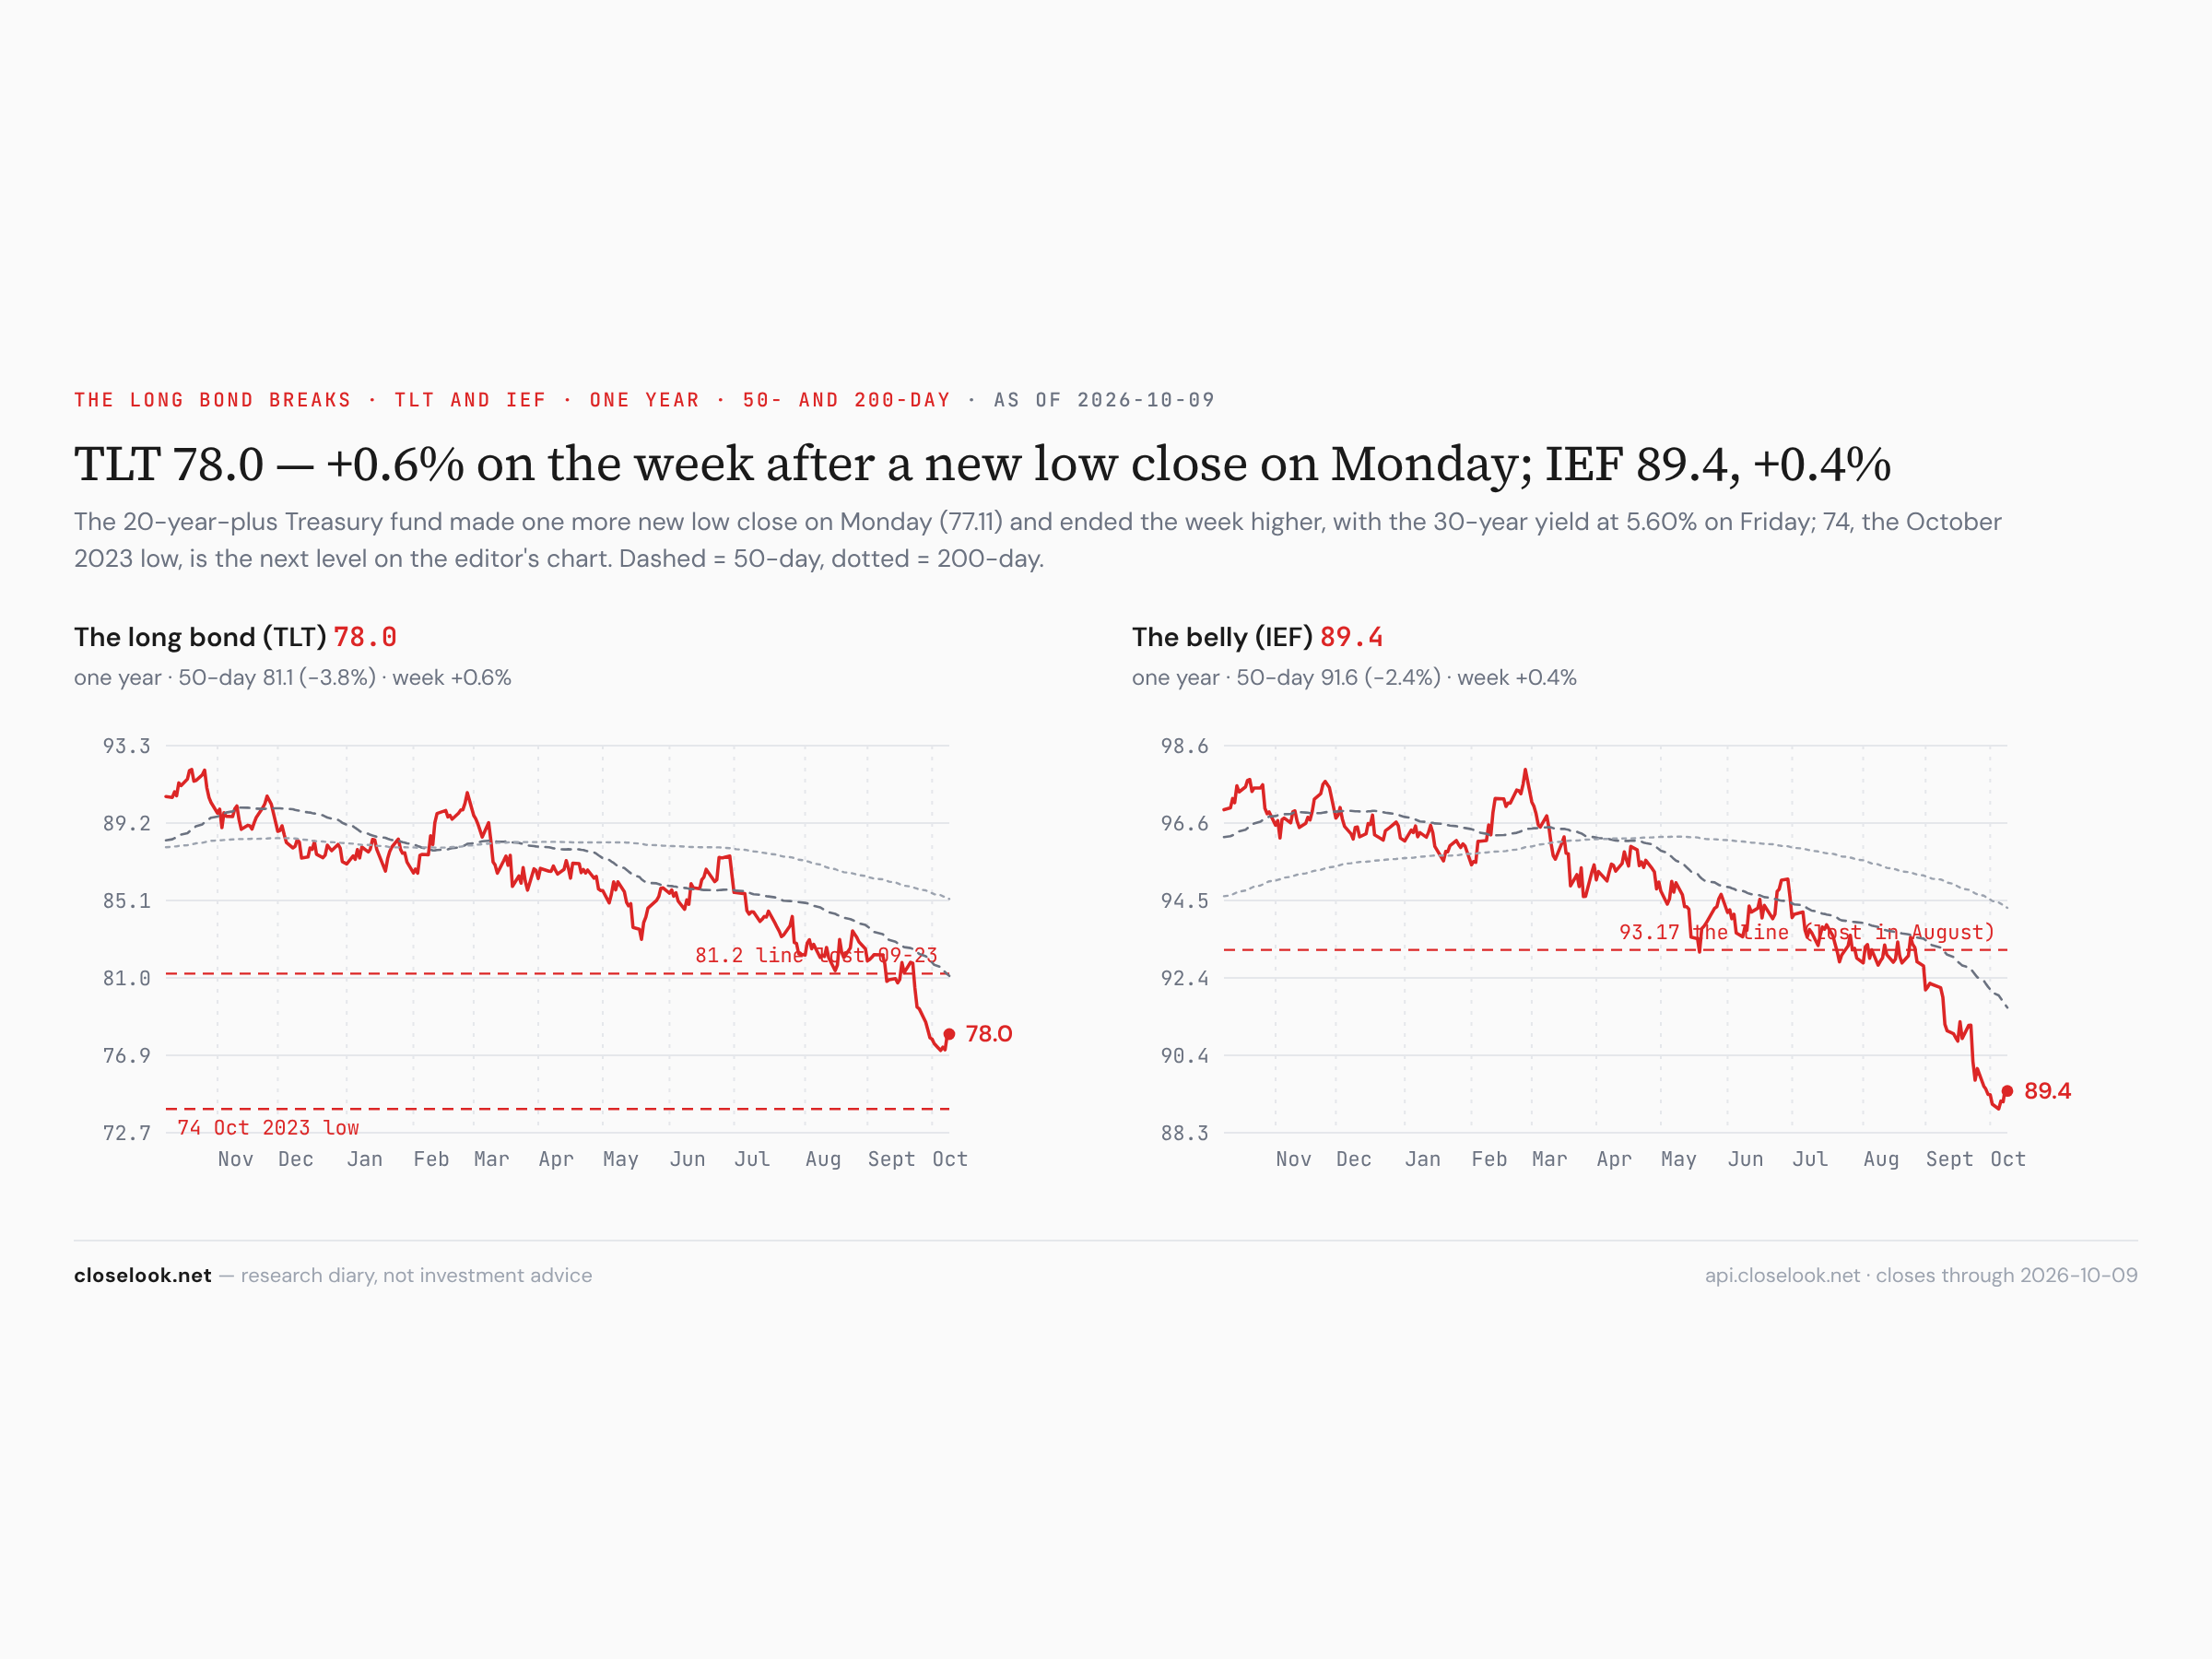
The nominal yields — the long end steadied. The ten-year closed at 5.24% (it touched 5.35% on Monday), the thirty-year at 5.60%, from 5.63%. The long-bond fund made one more new low close on Monday, 77.11, then closed the week at 77.98, +0.65%; IEF 89.40, a ninth week under the 93.17 line. The house sovereign pressure index fell from 0.59 to 0.04 — the pressure across the board's governments eased for the first time in weeks, the equal-weight ten-year at 4.36%.
The rate map — one sentence each. America: 5.24% on the ten-year, the reason growth — and now a Fed that talks about hiking again. Britain: 5.44%, 5.95% on the thirty-year. Japan: 3.02%. Germany: 3.49%. France: 4.87%, Italy 4.59%. The French ten-year pays 138 basis points over the Bund — unchanged from last week, after 113 two weeks ago; France pays 28 basis points more than Italy. The French spread stopped widening; it did not narrow.
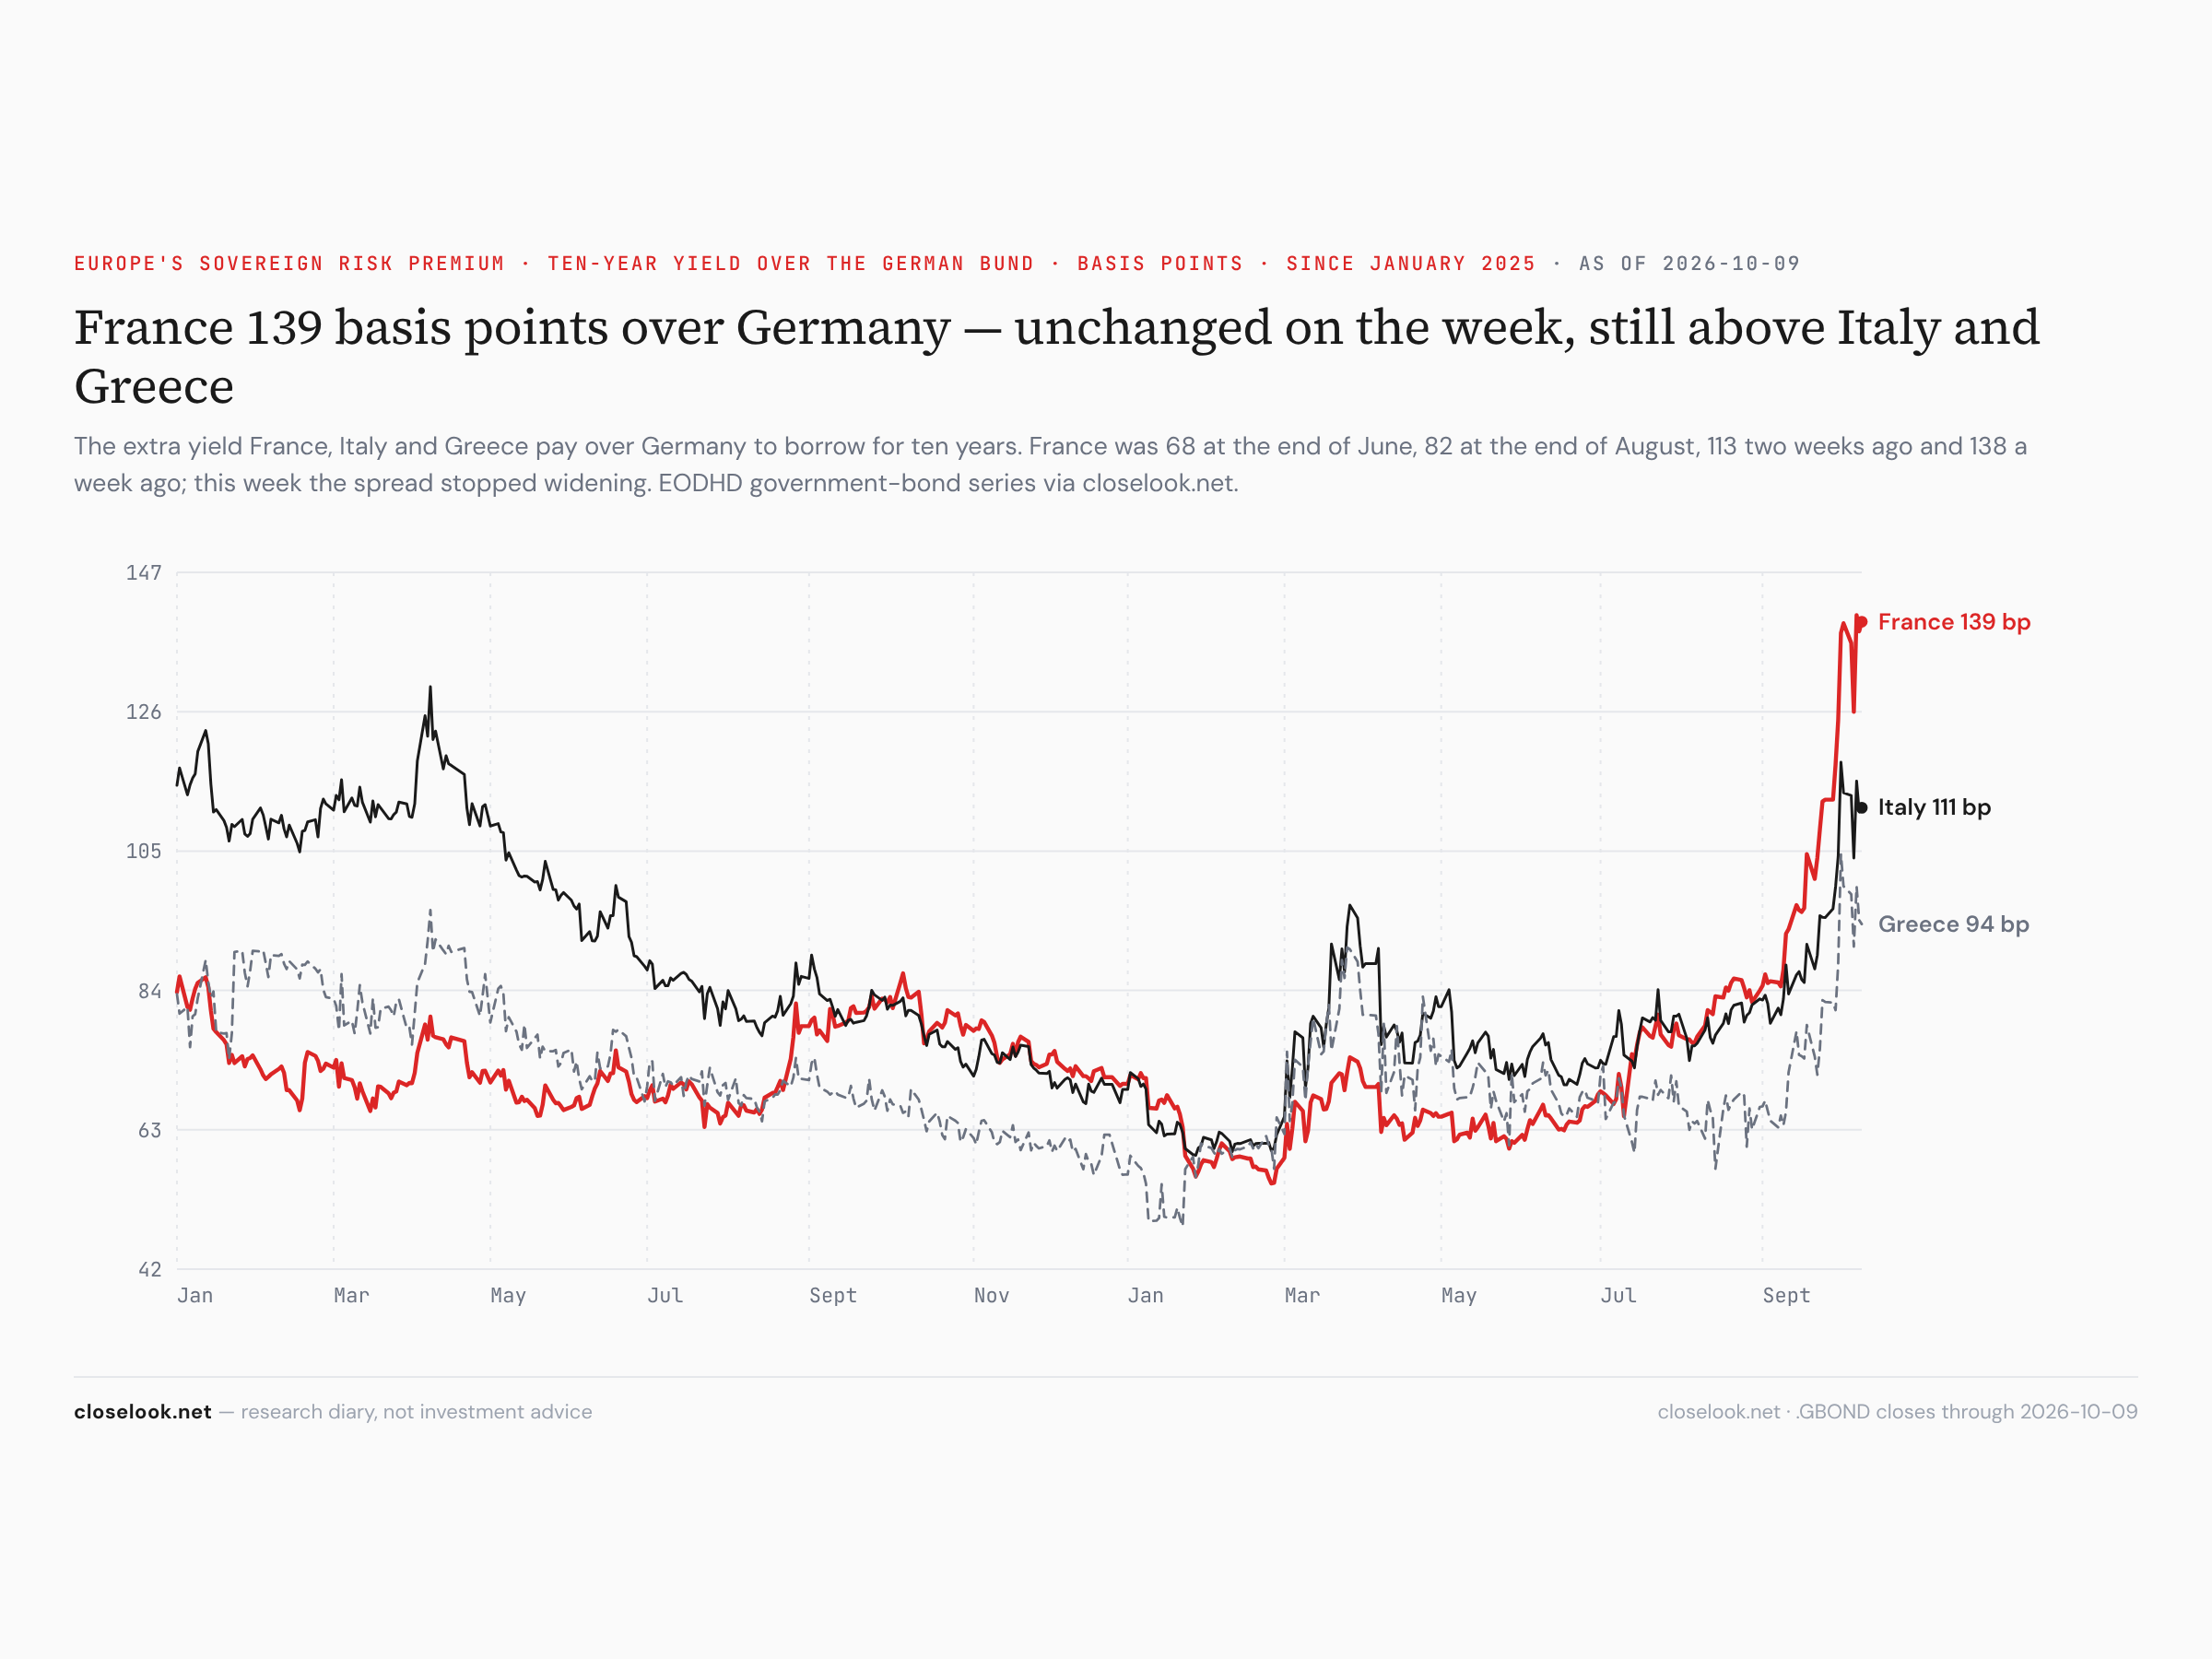
The consequence — the map holds, with one new entry. This letter's positioning, restated: this diary stays away from mainland Europe's core, and from France in particular; Greece and Poland stay the exceptions. This week adds one market to the watch-list on the other side: Brazil. Not as a call — a runoff in two weeks can reverse a first round — but as the clearest sign this year that money outside the AI trade is looking for a reason to move, and found one. This is a diary's positioning, not advice.
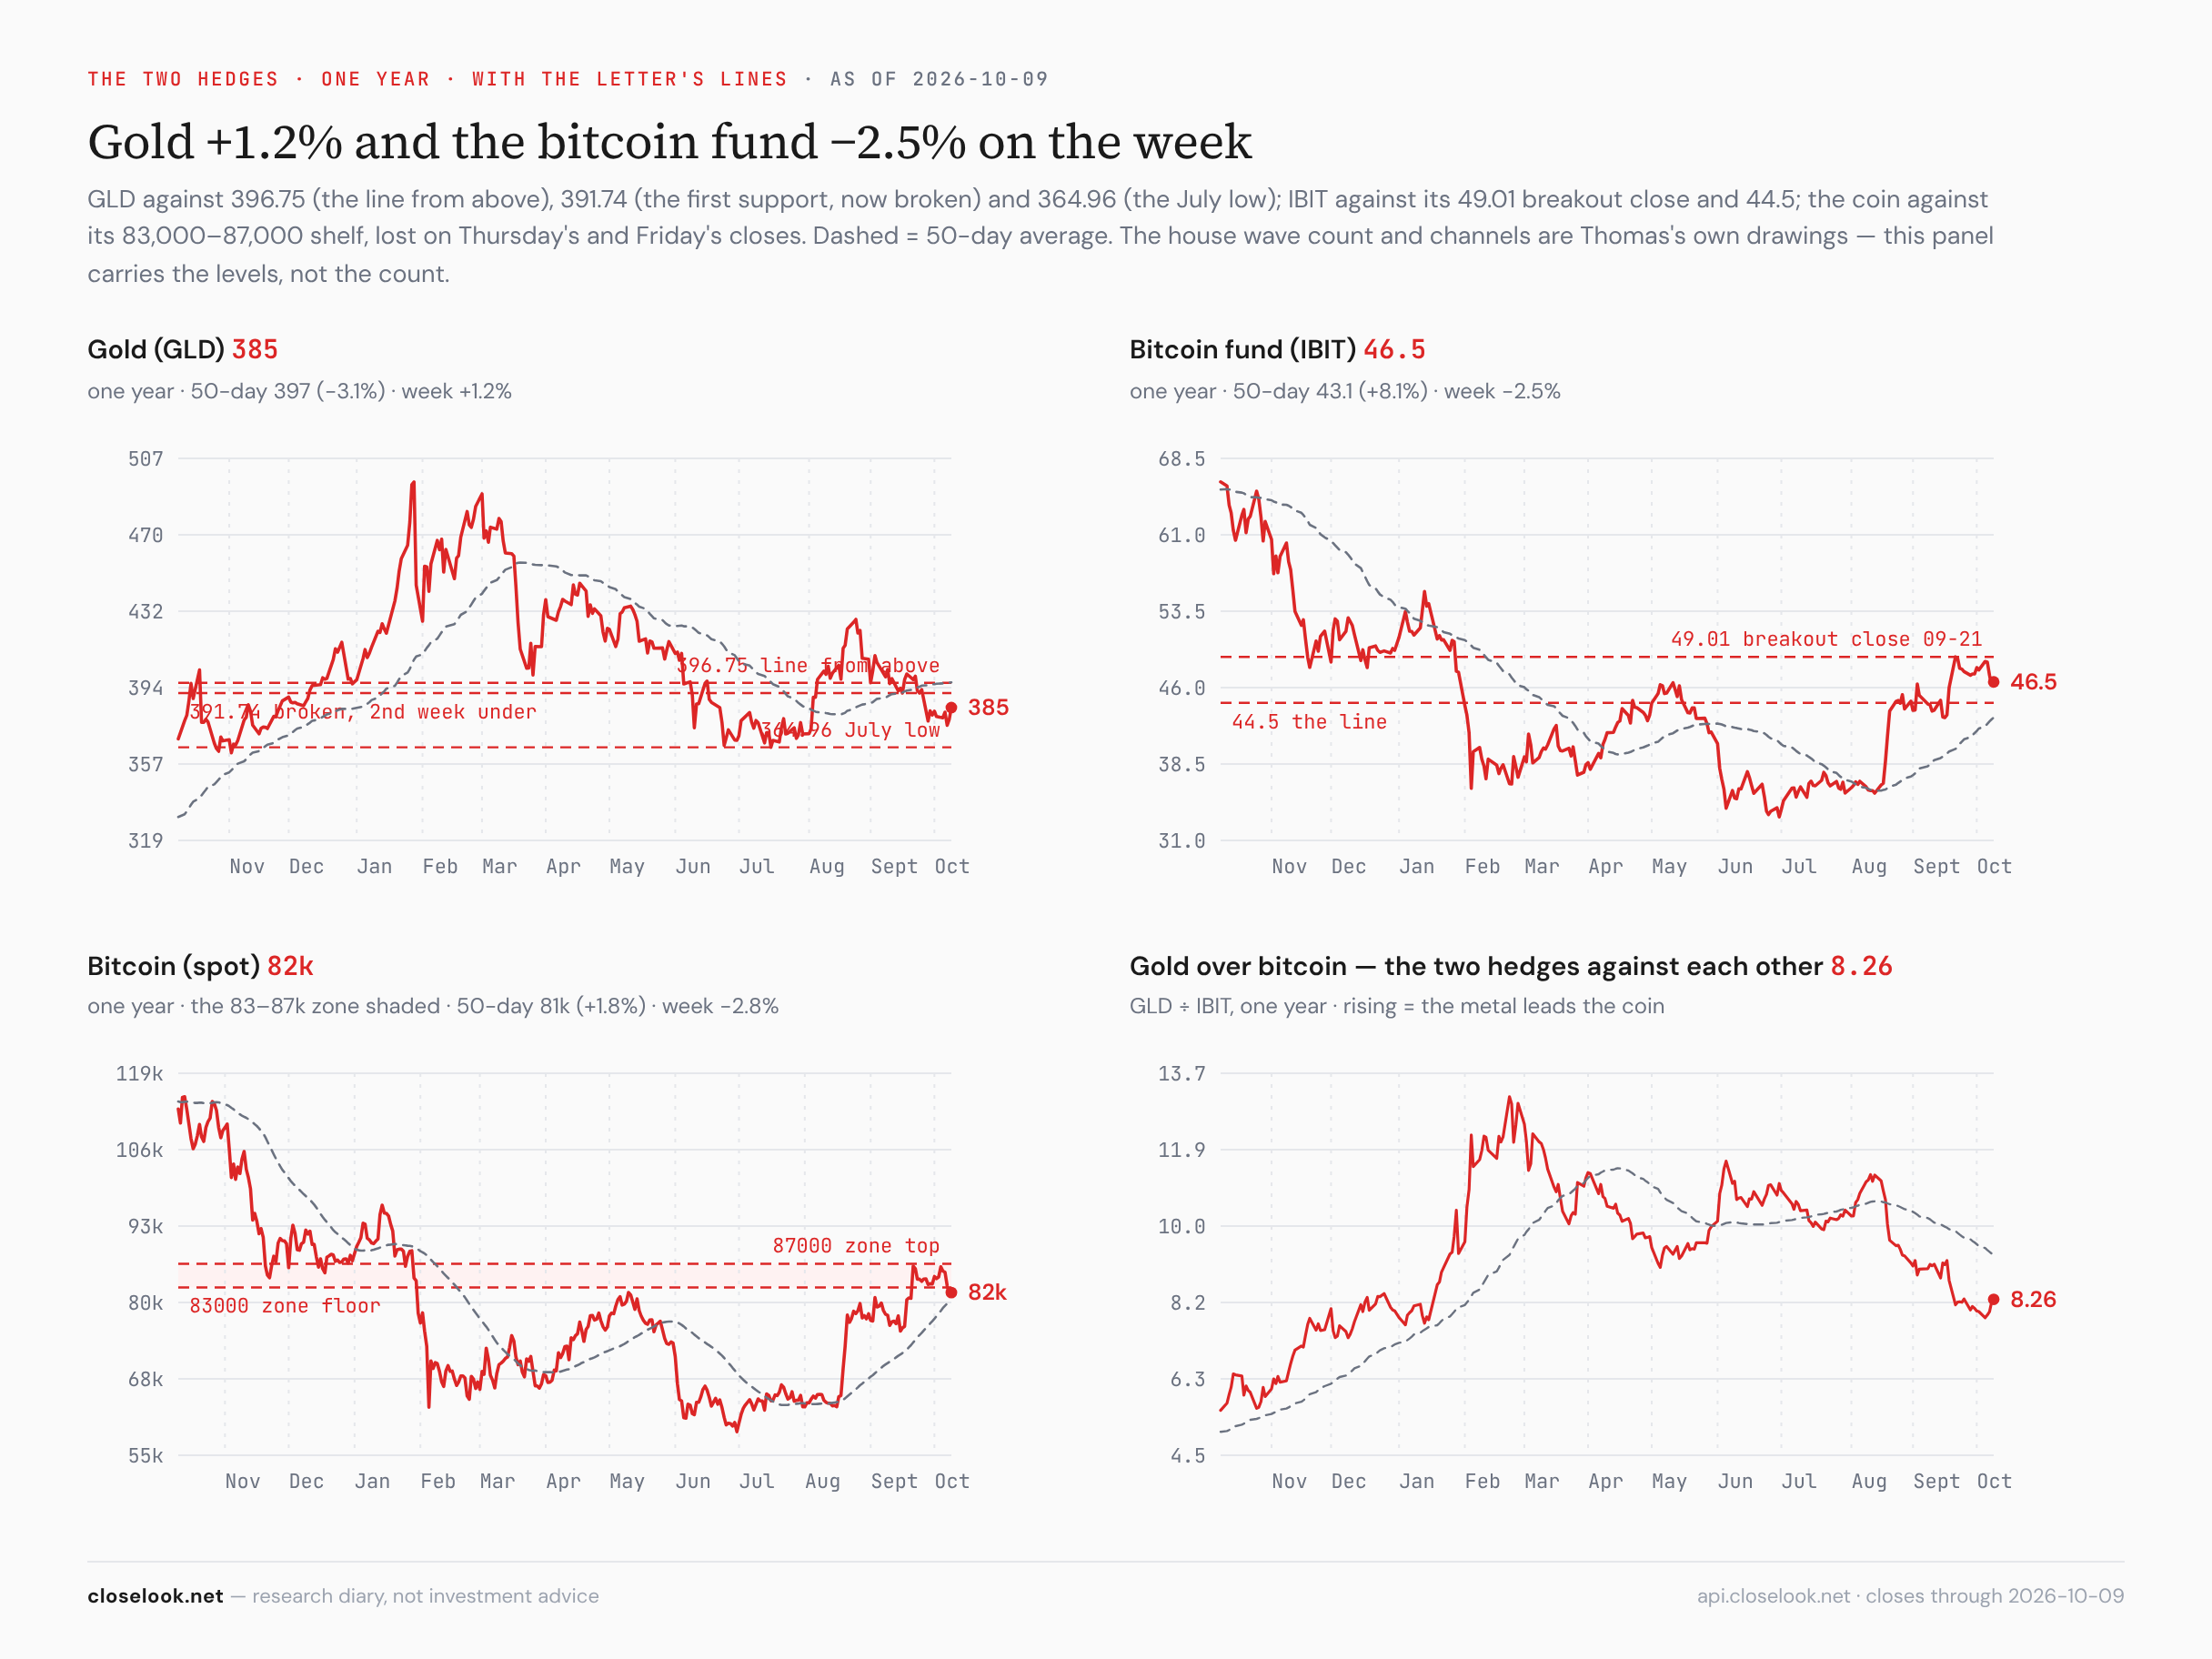
The hard assets — the metal steadied, the coin lost its floor. Gold rose 1.17% to 384.58 — but a second week under the 391.74 first support it broke at the end of September, which last week's letter said would make the break the trend. Bitcoin closed Friday at 82,123, −2.8%, with closes under the 83,000 floor on Thursday (81,676) and Friday — the floor this letter has held since September, lost on two closes. The fund closed 46.55, −2.47%, above the 44.5 line. A dollar at its high and real yields at their highest since 2008 are the textbook headwinds for both; this week the coin felt them more than the metal.
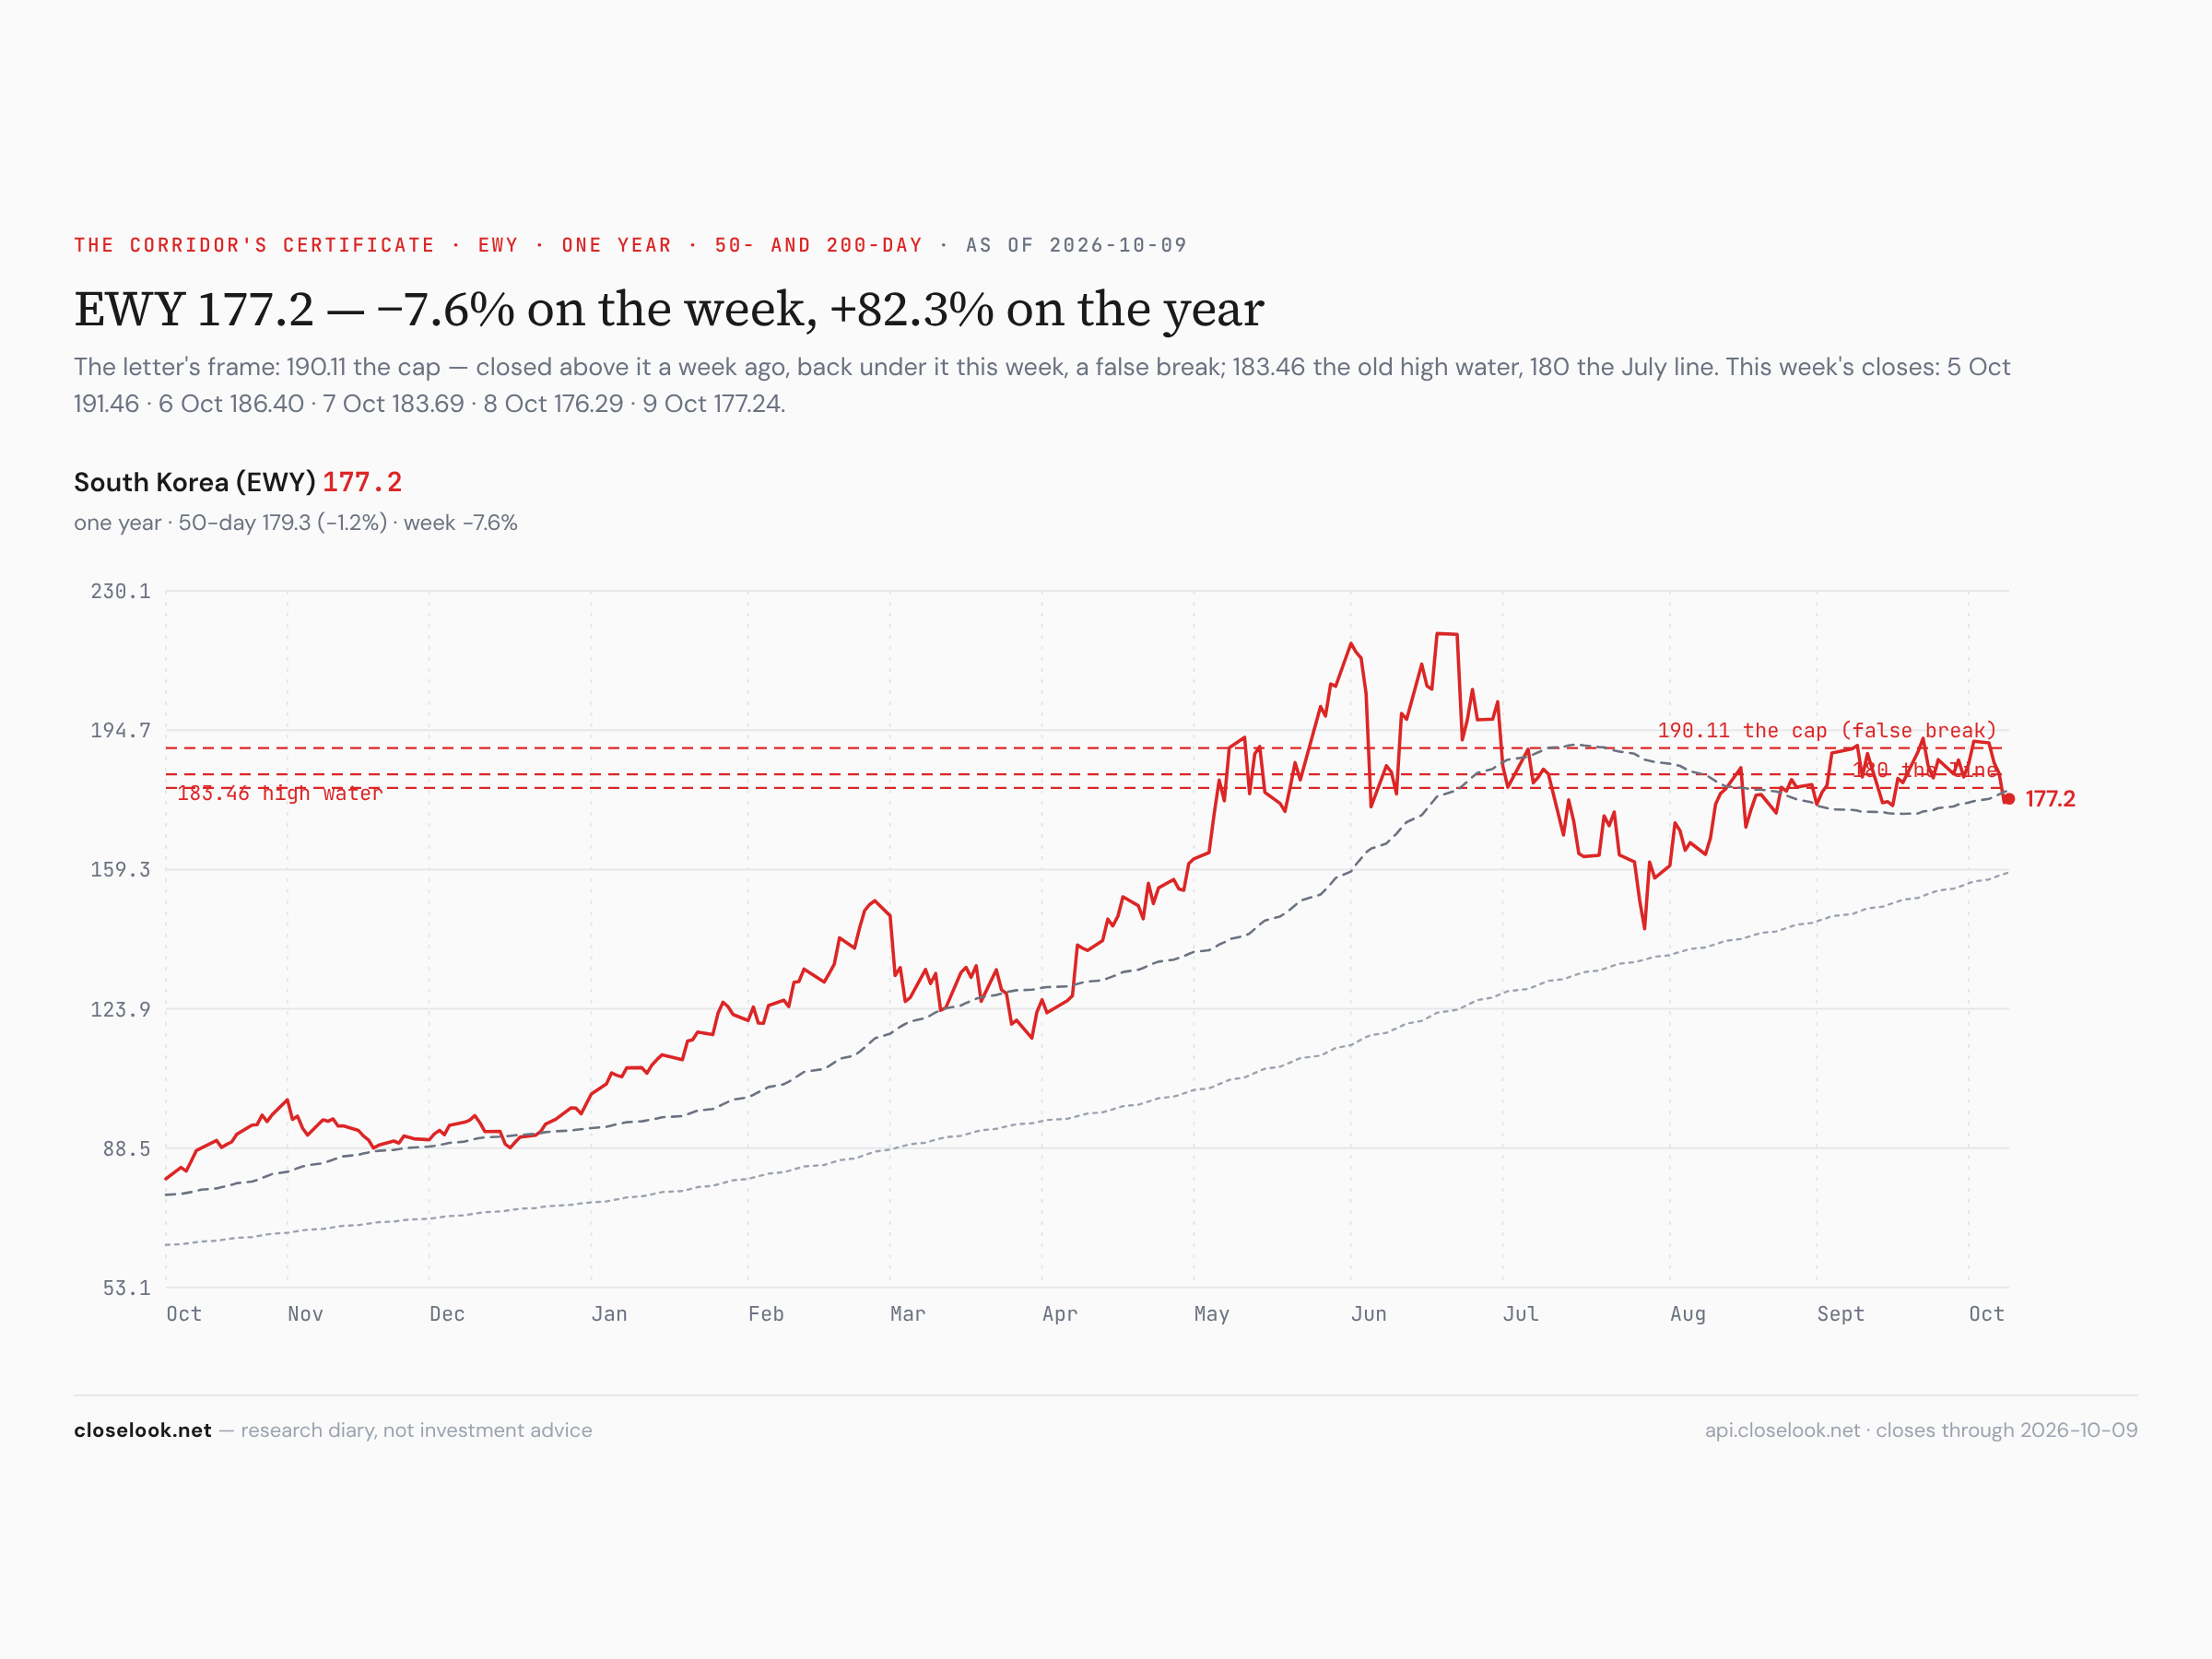
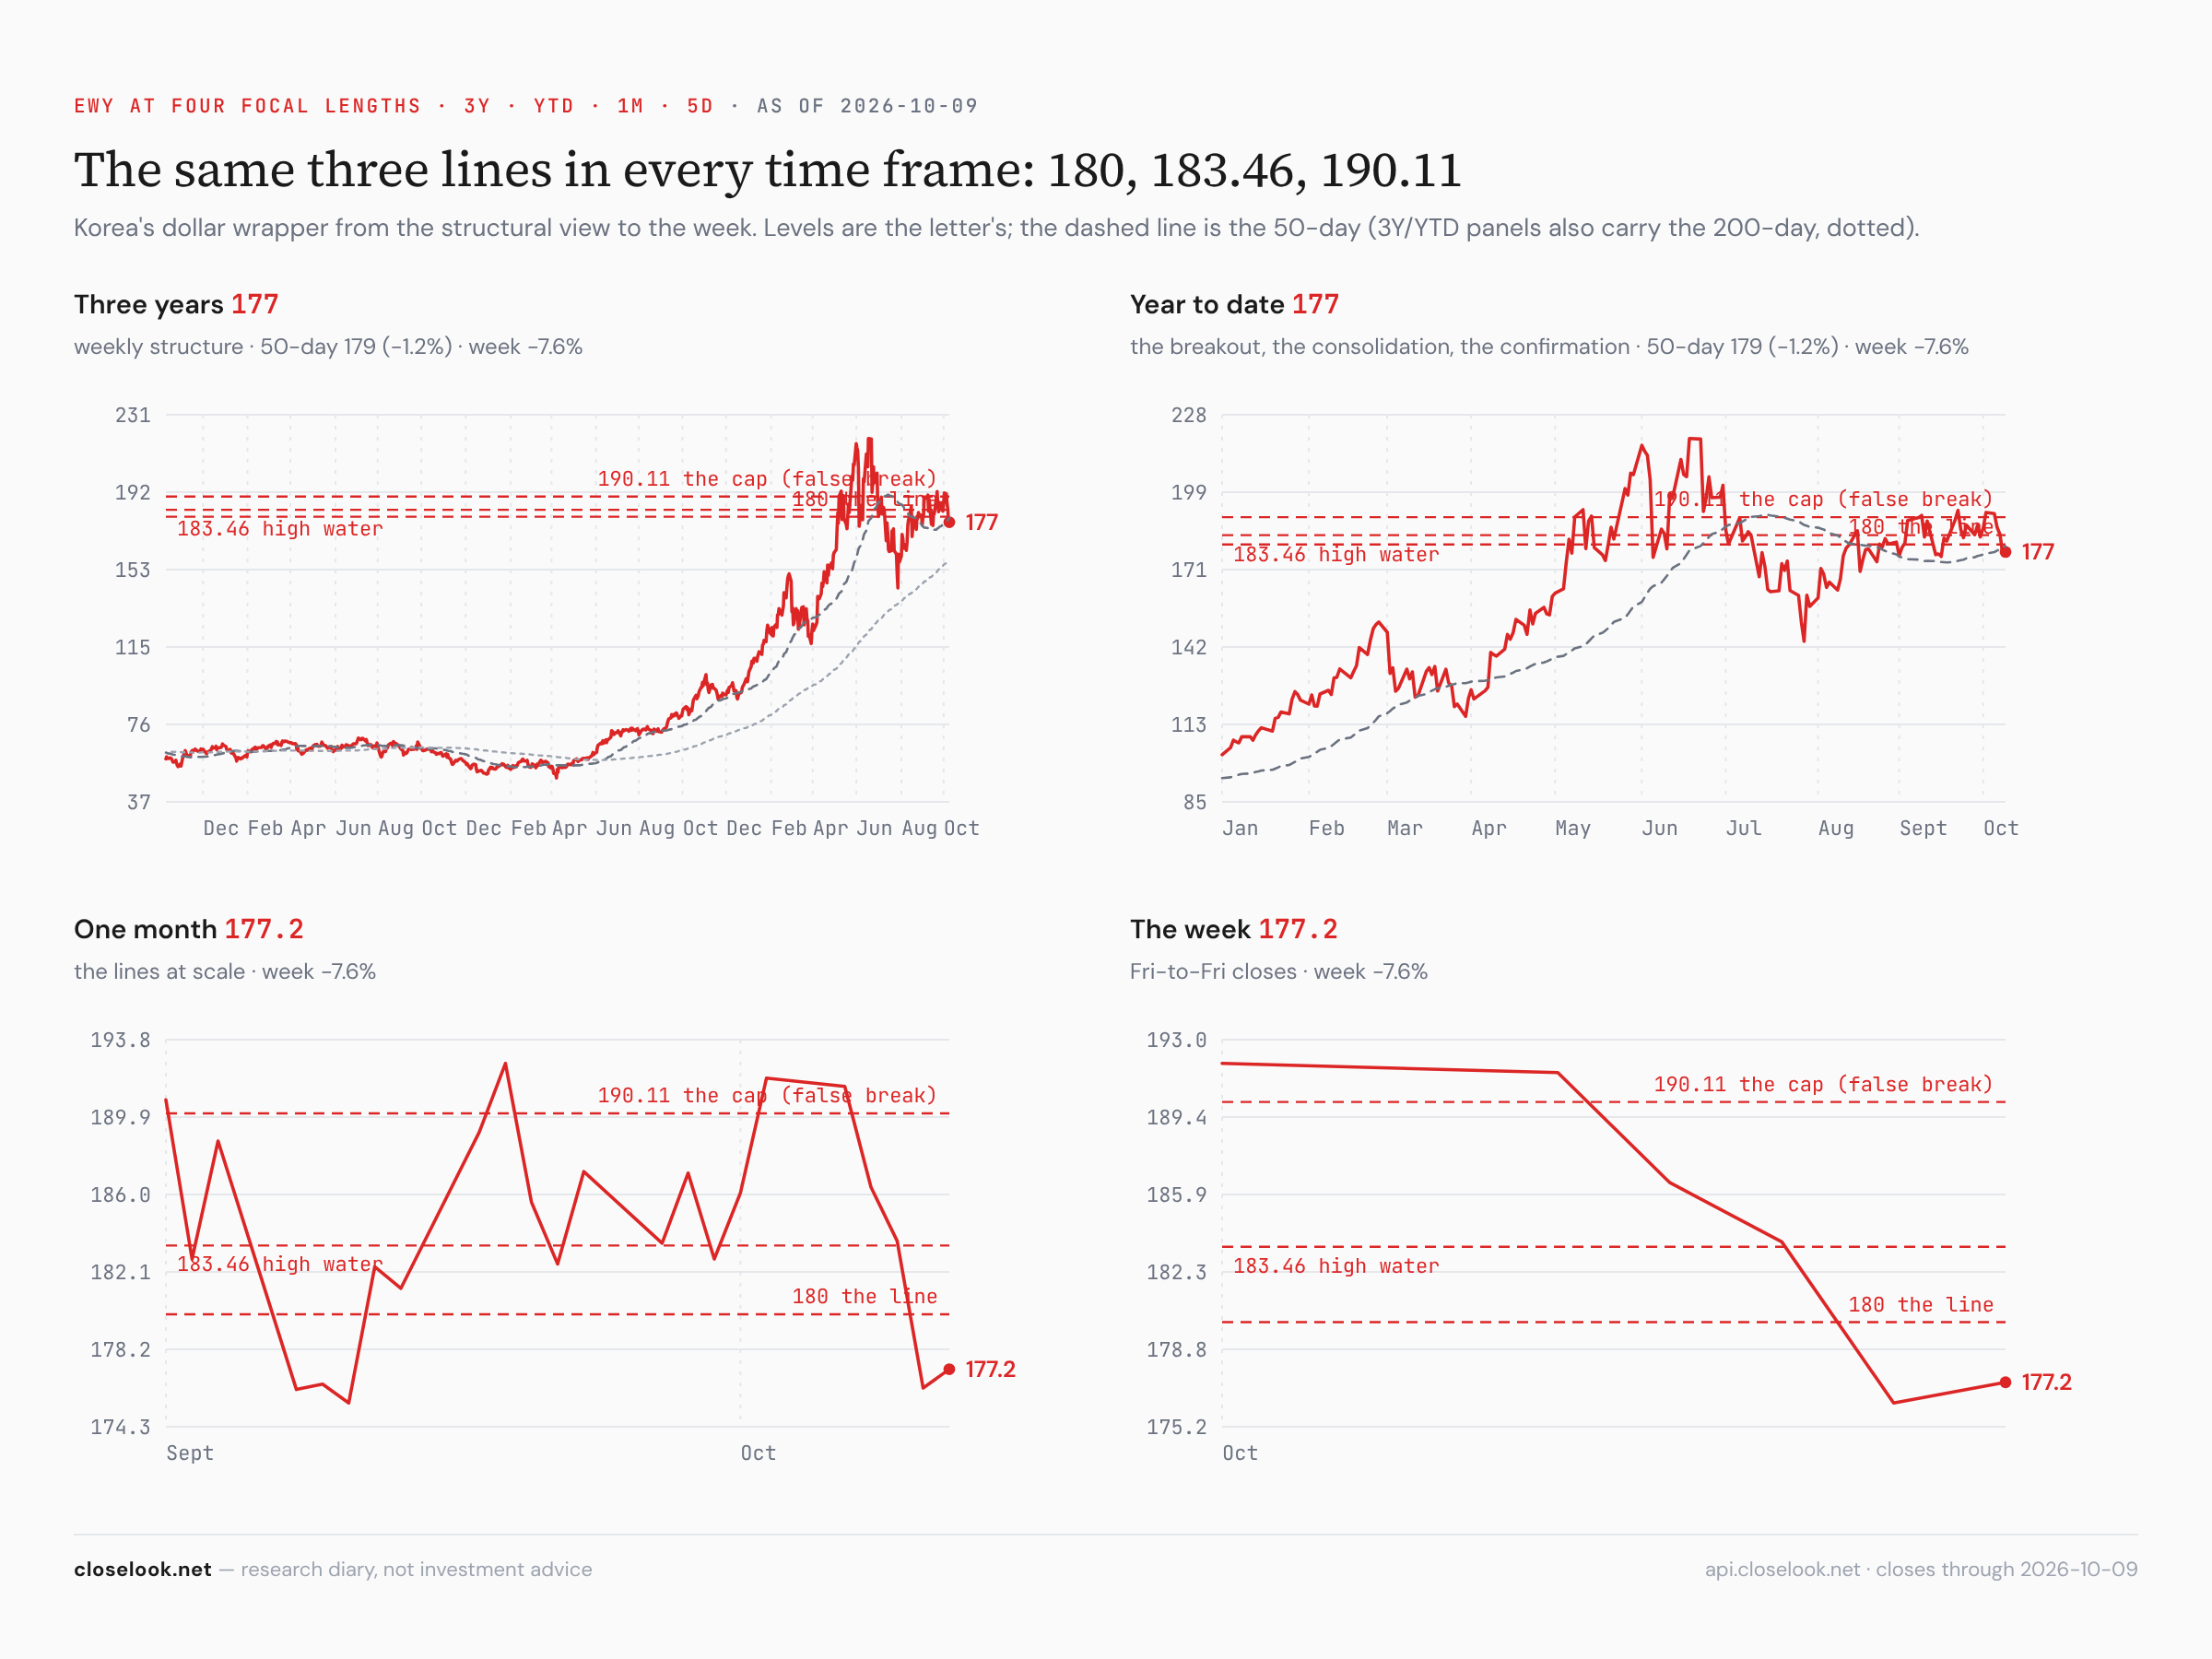
Seoul: the cap was a false break. The fund walked 191.46 → 186.40 → 183.69 → 176.29 → 177.24. Last week it closed above the 190.11 cap for the first time, and this letter said a weekly close back under it would make that close a false break. It did, by 12.87 points. EWY is 19.1% under its June high and +82% on the year — still the best market on the board in 2026, and the one that gives back fastest when the chips fall.
Taiwan: a record on Monday, then the drop. EWT closed at a record 118.00 on Monday, then 117.61, 116.24, 113.34, 114.31. Taiwan's market is a TSMC market, and TSMC's number was good; the market sold it with the rest of the corridor on Thursday.
Europe, the voting machine and the weighing machine. Last week Europe's equipment makers rose while Europe fell. This week they fell together: Euro-AI's semi-equipment layer −6.92%, chip architecture and cloud −10.84% — while enterprise AI and data rose 4.61%, Europe's own software. The same split as America's, at a smaller size.
The macro print. Three numbers: a 54.6% rise in TSMC's sales, a ten-year real yield at 2.95%, and a Fed whose minutes point to another hike. The first says the build-out is being paid for now. The second and third say money costs more in real terms than it has in almost eighteen years, and may cost more. For the equity map it meant one thing this week: the market kept buying growth, but it moved to the growth that does not need the next round of capital spending to arrive.
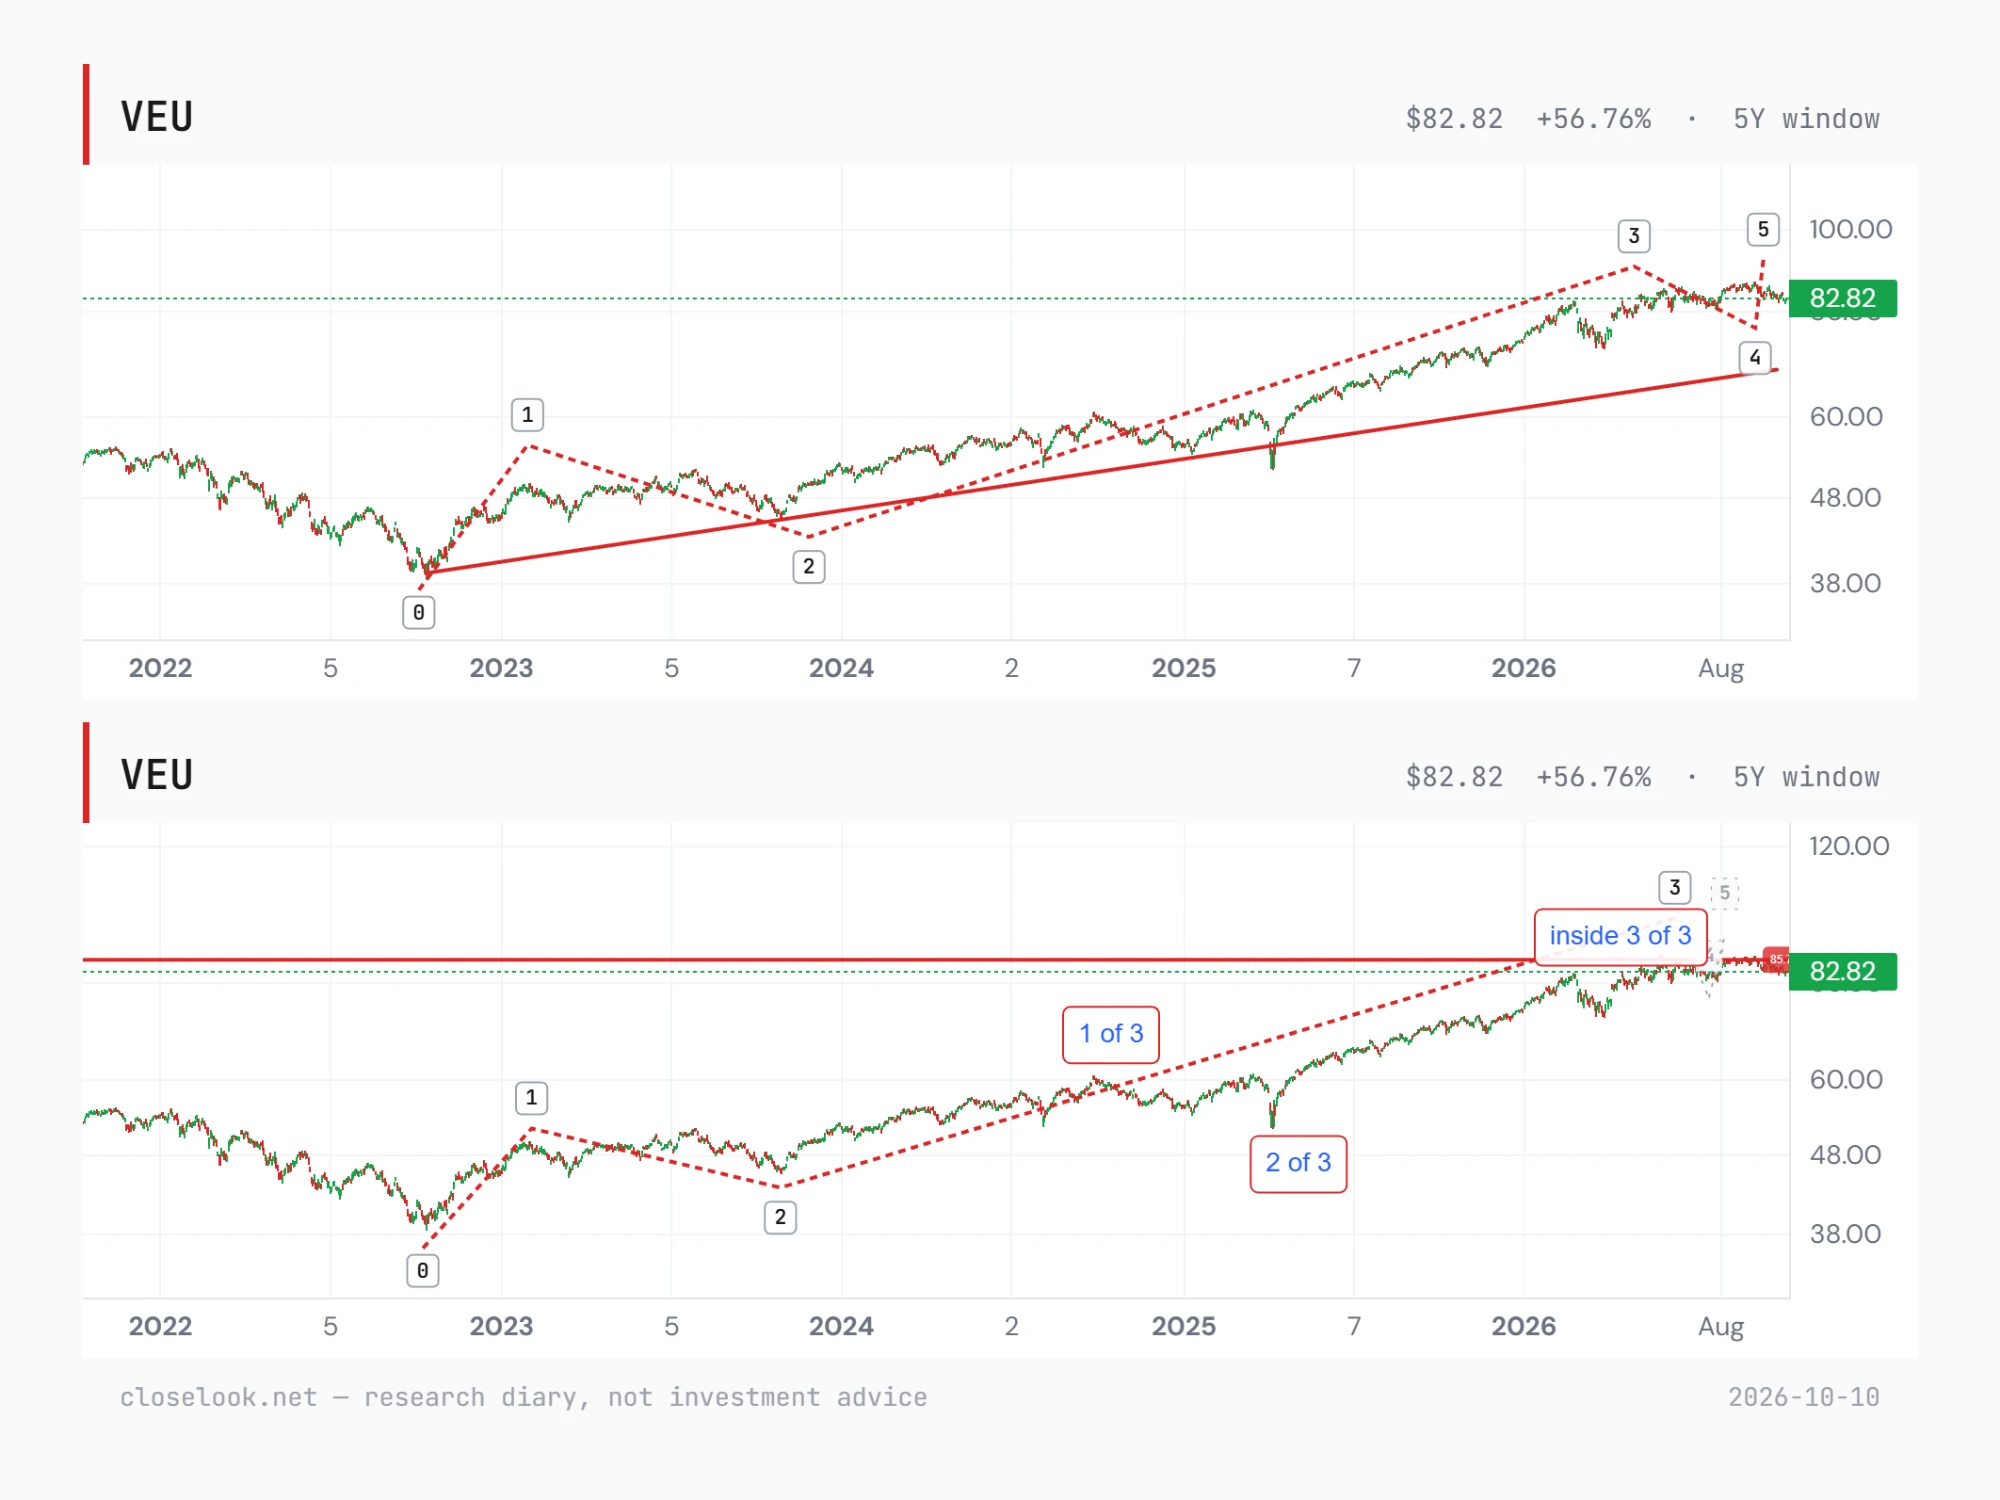
The structural read — the wave count, five years up: still in wave 3. From the October 2022 low the house count on the world ex-US reads waves 1 and 2 complete and wave 3 in progress, and last week this letter said a weekly close under 82.85 would put that count to the test. Friday's weekly close was 82.82, three cents under the line. The editor has redrawn the five-year chart with two counts — and both are bullish.
The preferred count (lower chart): wave 3 is still running, and it has its own five parts. Wave 1 ran from the October 2022 low into early 2023, wave 2 corrected into late 2023. Since then wave 3 has unfolded in smaller steps of its own: its first leg ended in late 2024, its second was the April 2025 drop, and the index is now inside the third of the third — the part of an Elliott count that is usually the longest and strongest. On this count the move from April 2025 to the September record was the start of that leg, and this autumn's pause sits on the shelf around the record (the red line on the chart), not under it. The pattern's next large step is up, not down.
The alternative (upper chart): wave 3 is done, wave 4 is running. Here the top of wave 3 came this year, and the market is in wave 4 — a correction that can take the index down toward the rising trend line drawn from the 2022 low before a fifth and final wave carries it to a new high. On this count a further drop is possible first; the trend line, now well under today's price, is where wave 4 would be expected to end.
What the two have in common is the direction. Neither count ends the advance that began in 2022; they disagree on whether the next big move comes now or after one more decline. The preferred one is the more bullish: it reads three cents under 82.85 as noise inside a strong wave, not as the end of it. What would separate them: a weekly close back above 84.30 and then the 86.41 record supports the preferred count; a slide toward the long trend line is what the alternative expects. (Editor's count, 10-10.)
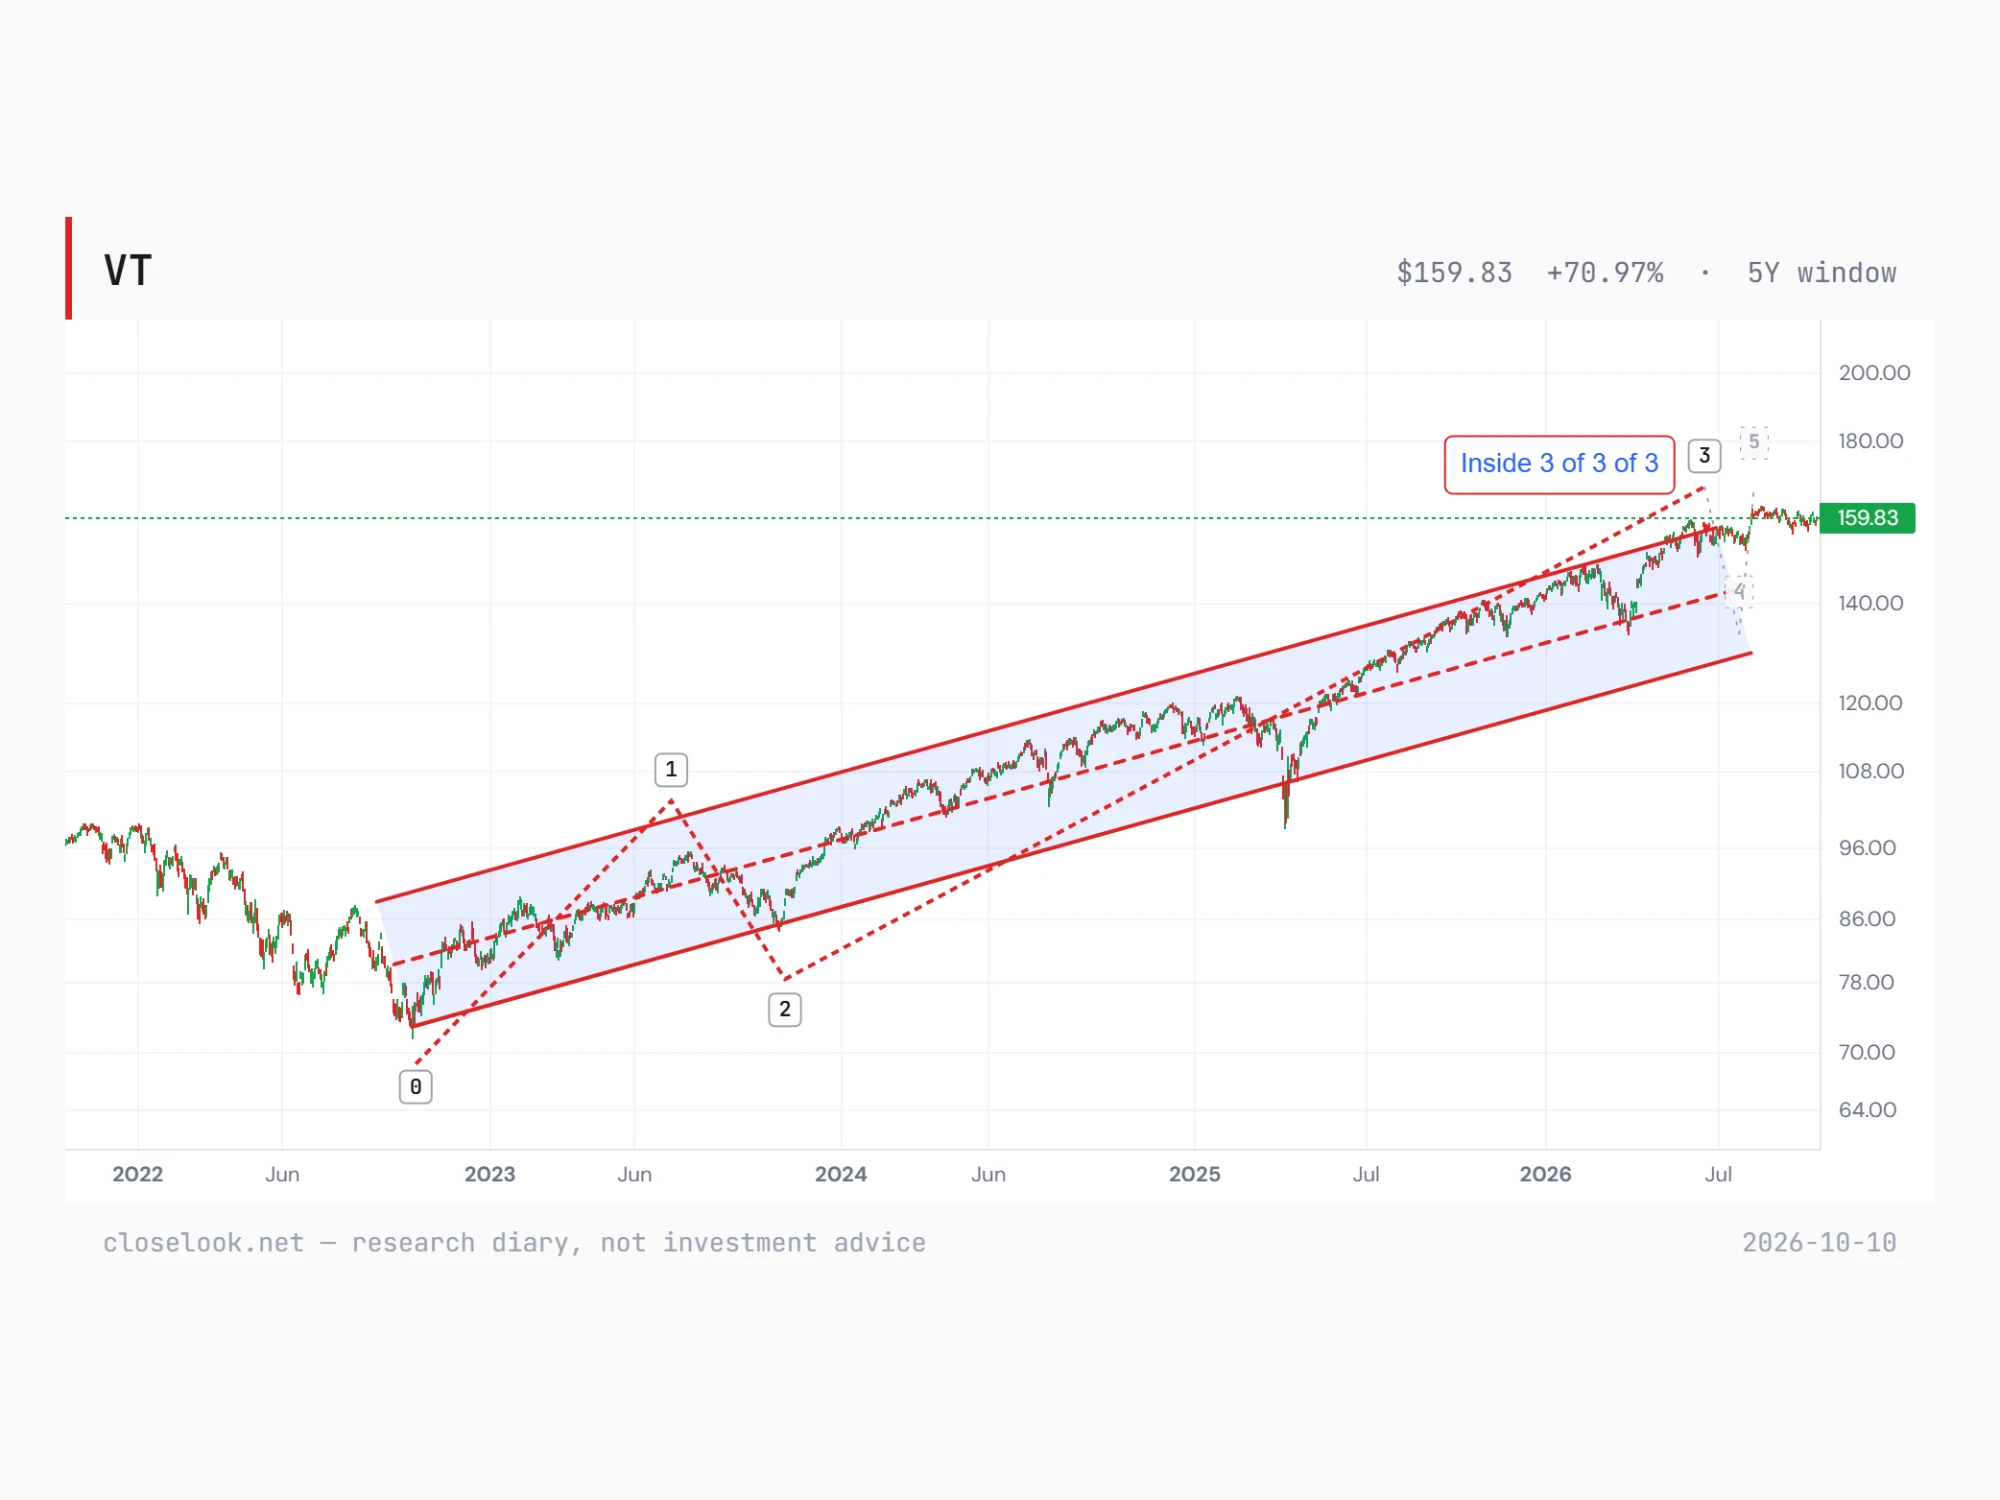
The all-world index — the same count, one degree stronger, because of America. The editor's five-year count on VT reads the same structure further along: inside the third wave of the third wave of wave 3 — a rising channel from the October 2022 low, with the price at its upper edge rather than at its floor. VT closed at 159.83, 1.6% under its August 13 record of 162.39; VEU at 82.82 is 4.2% under its record. The difference is America: about six tenths of the all-world index is American stocks, and the American part is what took the year back this week. On the five-year window the gap reads VT +71% against VEU +57%. The same wave structure, a stronger position in it — the stay-home case drawn as a chart.
3 · The Outlook
The three-index read — the builder fell, the sellers rose. We read the three together because they are three stages of one spend: capex (Rubin Build-Out, what gets built), opex (Agentic Ecosystem, what it costs to run), applications (Agentic Winners, what gets sold on top).
Capex −3.44% on the week to 2,094.58, four of thirty-six sub-indices green, +103.8% on the year. Opex +2.76% to a record 1,786.36, +81.0%. Applications +4.91% to 942.64, all nine sub-indices green, −3.7%. Last week the builder rose six percent and the applications fell. This week the order reversed: the applications index rose every day, the opex index closed at its high on Friday, and the builder fell 5.0% in two sessions on Wednesday and Thursday.
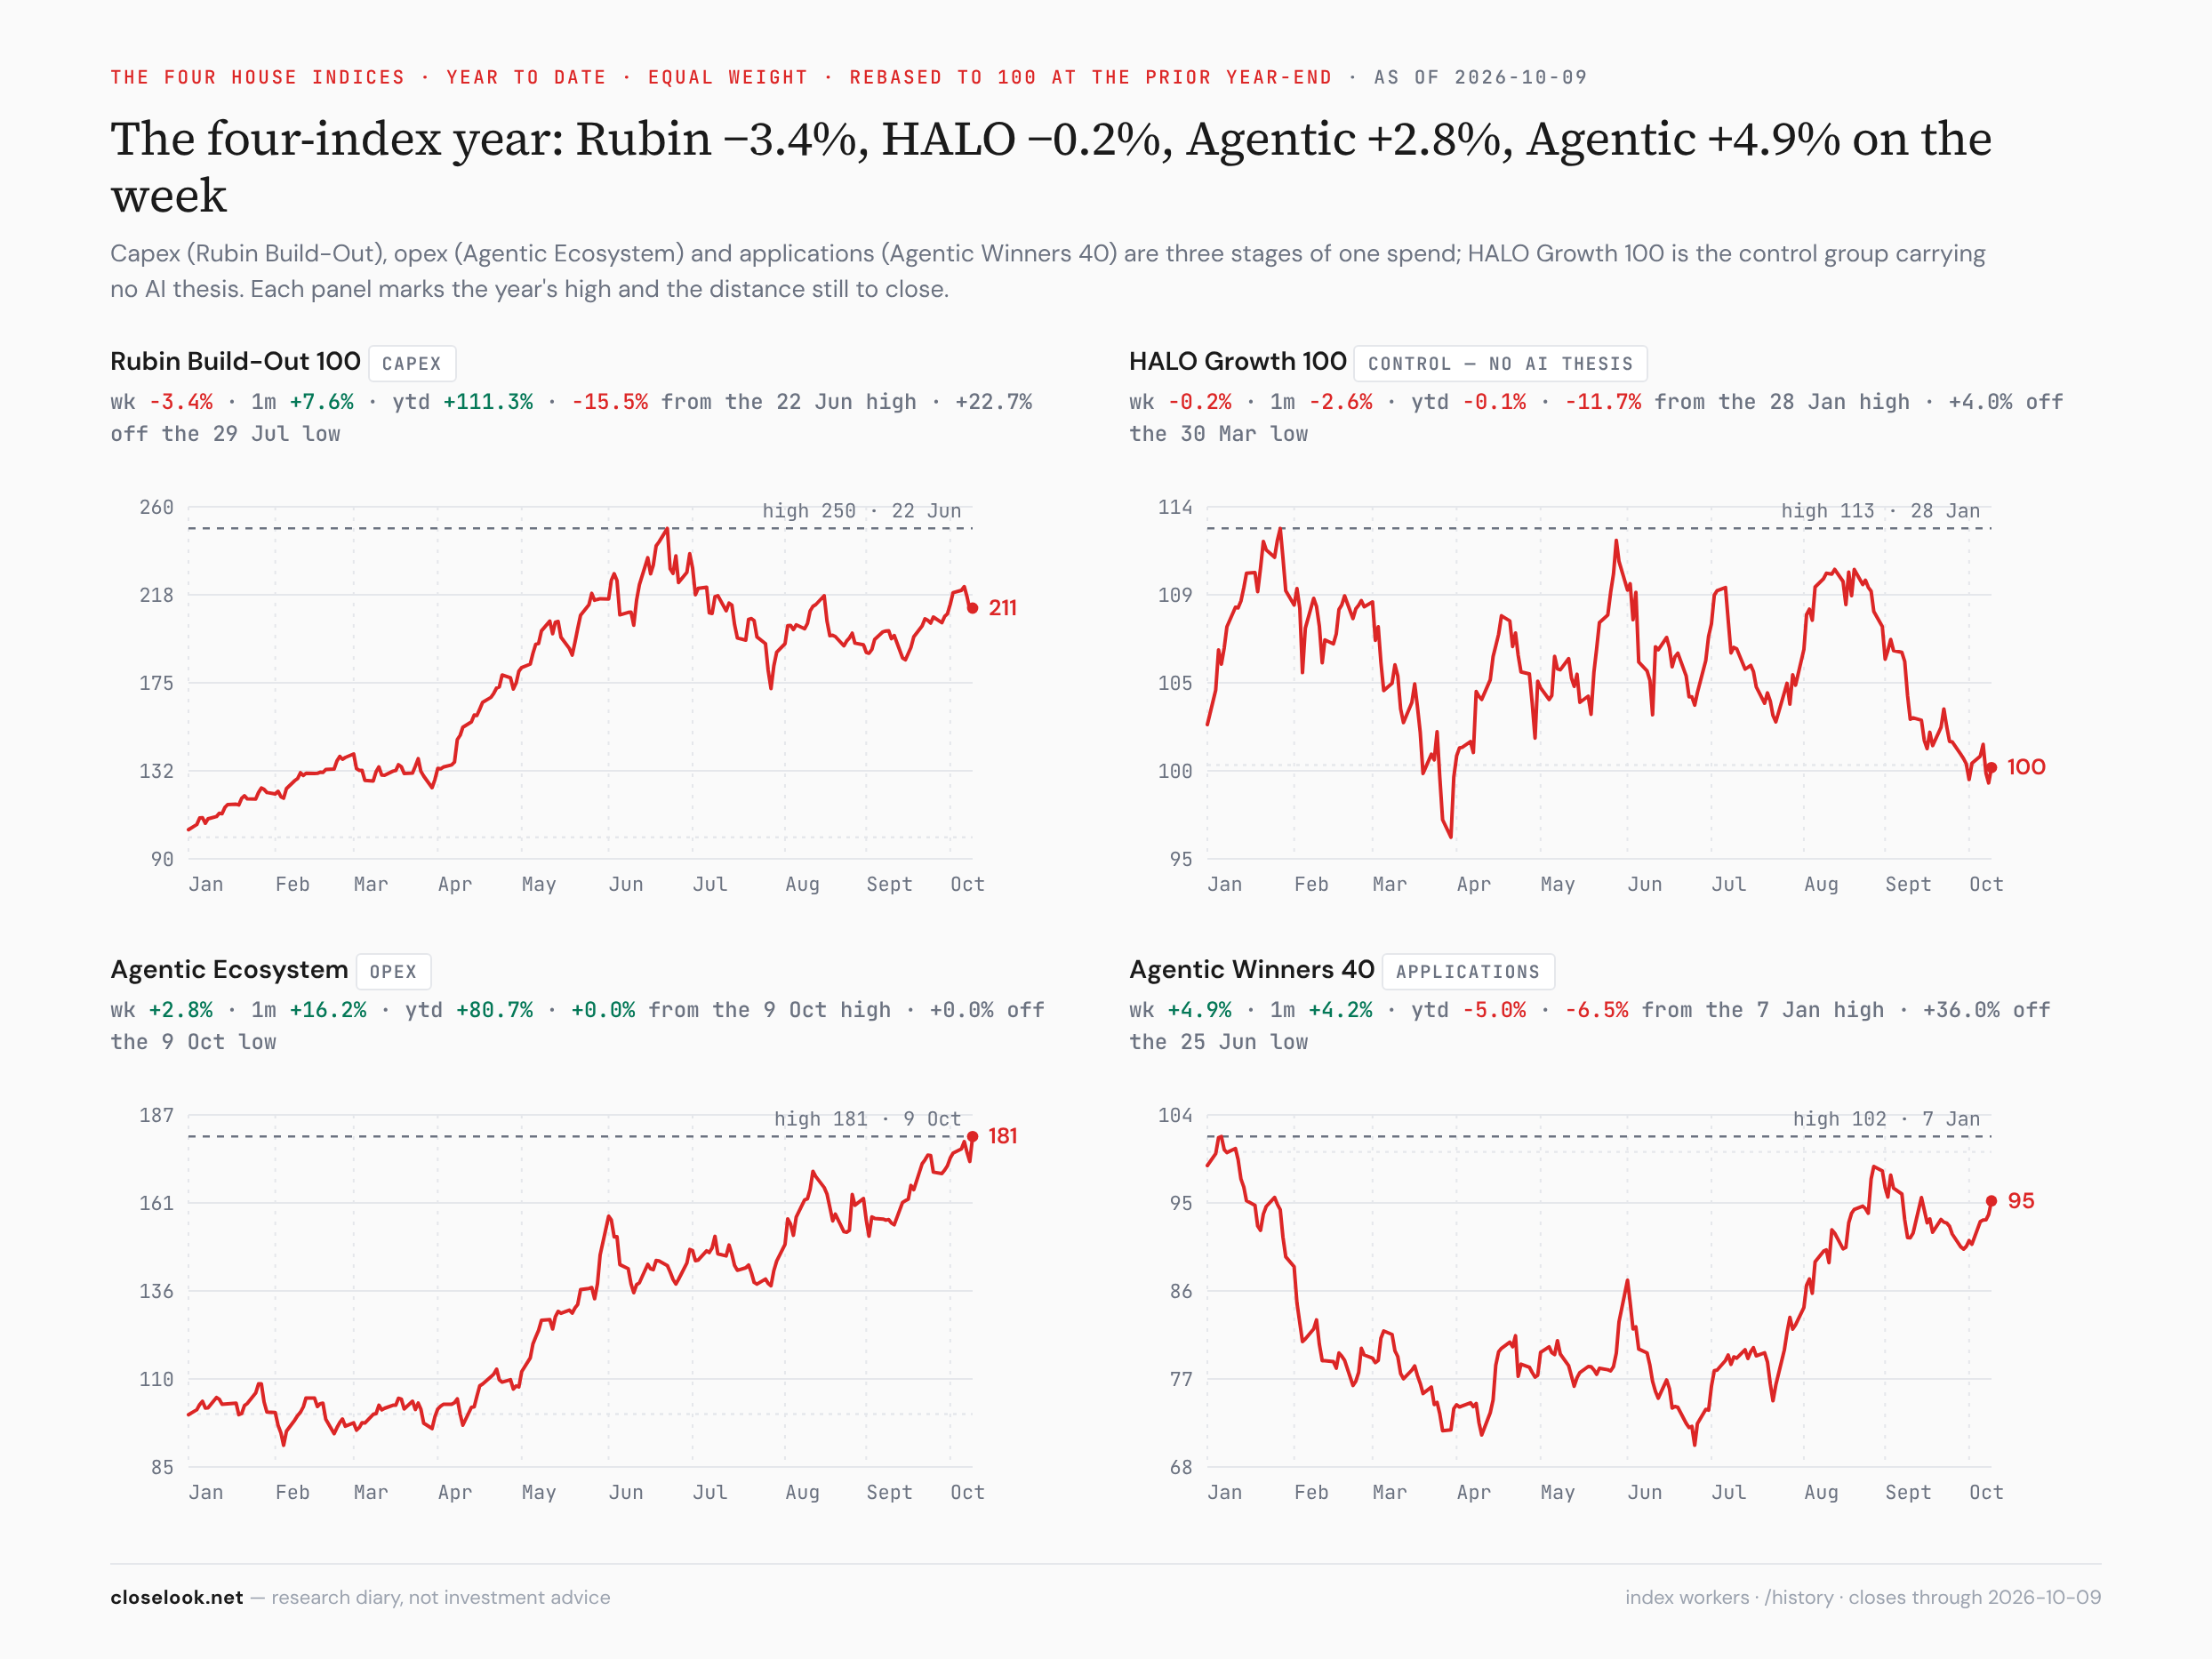
The control group was flat. HALO — our growth index carrying no AI thesis — fell 0.23%, −2.3% on the year. Inside it, payments +7.35% and Latin America +6.08% — Brazil's week, inside a growth index — while the speculative and Asia-Pacific legs fell 9.6% and 7.2%.
Read the windows together. On the year capex still leads: +103.8% against +81.0% against −3.7%. On the month opex leads: +16.2% against +7.6% against +4.2%. The AI economy is still mostly being paid for at the bottom of the stack — but for the first time in weeks the top of it was where the money went.
The distances to the highs. Opex at its record. Capex 15.5% under its June 22 high, 22.7% above its July 29 low. Applications 6.5% under its January high. HALO 11.7% under January.
Inside capex: almost everything red. The four green: wafer processing +1.66%, thermal management +1.04%, AI factory systems +0.68%, data-centre construction flat. The worst: advanced packaging and bonding −7.96%, Europe's constituents −7.78%, storage −7.41%, power semiconductors −7.26%, machine vision −6.26%.
Inside opex: the security and operations layers. Ten of fourteen green: agentic security +7.00%, govern and secure +6.72%, operations and observability +6.62%, data and memory +6.18%, identity and trust +5.73%. The red four: Europe's constituents −7.52%, compute operators −6.76%, runtime and API gateways −3.24%, substrate −1.76%. The compute operators — the neoclouds that rent out GPUs — fell with the builders; the software that secures and watches the agents rose with the sellers.
Euro-AI, for the ladder's sake. The sovereign-Europe index fell 2.18% to 1,291.05, +29.1% on the year, 7.2% under its June high. Enterprise AI +4.61%, medtech +3.52%, industrial AI +1.40%; defense −2.62%, power and cooling −3.29%, semi equipment −6.92%, chip architecture −10.84%.
The regime gauge. The Money Temperature board closed the week at 57, unchanged — "mixed / transitional", the middle of neutral and, by its own construction, not a signal. The instruments: the S&P 71, the dollar 68, the Nasdaq 100 59, the long bond 55, gold 51, the world ex-US 50, emerging markets 50, bitcoin 49.
4 · What May Lie Ahead
The fourth quarter — stay home, still, with the address changed. Last week this letter set its expectation for the rest of 2026: the map that formed this quarter continues into the fourth — America and Asia's corridor lead, mainland Europe and India trail, the dollar stays firm. One week in, America leads the year for the first time and the dollar is higher; the corridor fell. The expectation stands with one change: inside the AI trade, the lead has moved from the builders to the sellers, and the chip countries were the cost of that move. A stay-home portfolio owns both halves; a portfolio that went abroad for the corridor owns only the half that fell.
The season — the uncertain stretch has started. This letter expected uncertainty before the reporting season opens in mid-October, and named the stance: buy dips, do not chase. The chip drop is the first dip of that stretch. Whether it is the one to buy depends on what the first reports say about next year's spending — not on this year's, which TSMC has already confirmed. Probability, not prophecy.
The calendar. ASML reports on Wednesday, 14 October, and TSMC its third quarter on Thursday, 15 October (vendor calendar). Both now carry a different question than a week ago: not how much was sold, but how much the customers plan to spend in 2027. Brazil's runoff is on 25 October. The midterm elections are on 3 November.
Levels and tripwires — VEU first, under the line. The marks: 86.41 the record close (September 4); 84.30 resistance; 82.85 the structural line — lost on this week's close by three cents; 82.18 Thursday's low close. Restated: a weekly close back above 82.85, then 84.30, supports the editor's preferred count — wave 3 still running; a slide toward the rising trend line from the 2022 low is the alternative count's wave 4. Both counts are bullish on the larger trend (§2).
The long bond — the low held for four days. TLT 77.98, with 77.11 Monday's new low close; 74, the October 2023 low, is 5.1% below. Above, 81.2 is the line to reclaim. IEF 89.40, nine weeks under 93.17.
Real yields — the level to watch. 2.95% on the ten-year TIPS yield is the highest since 2008; 3.15%, the 2008 peak, is the line above it. A weekly close above 3% with earnings expectations falling is the first row of the table in §7.
The dollar and the euro. The dollar fund's 29.04 is the year's high close. EUR/USD 1.1200 is the year's low close — a weekly close under it extends the move. USDJPY 158.26: 160 the door, 155 the level that brings the intervention talk back.
EWY 177.24 — back under the cap. 190.11 the line from above again, 183.46 the old high water, 180 the line it lost on Wednesday. The next weekly close decides whether Korea's week was a correction inside the year's trend or the start of a longer one.
DRAM 57.19 — under 58 for the first time in five weeks. 58 the line from above, 80.72 the June high. The memory trade had the worst week of the corridor.
The four global sectors that decide the tape. Technology 149.84 — ten cents above the 149.74 June high; a weekly close under it says the record was a reach. Industrials 189.76. Financials 127.56 — a fifth week under the 134.55 August line. Materials 109.08 — a seventh week under 116.54.
The hard assets on the board. Bitcoin: 83,000 lost on two closes — now the line from below; 80,337 the week's low; 87,000 the close that would restore the breakout. The fund: 44.5 the line below. Gold: a second week under 391.74 — the break is the trend; 364.96, the July low, is the level below.
The non-tech growth focal areas — the calendar read, revised a seventh time. Last week health care left the list. This week health care rose 2.8% in the US and 2.3% globally, staples and utilities led both boards, and security rose again (+5.1%). The honest reading has not changed: the sort is by news, and a weekly letter naming a sector is mostly naming last week's news. Security stays on the list through every revision.
Next week's docket. Through the week: the reporting season opens; this diary's PepsiCo window closes on Tuesday and Delta's on Wednesday (the US letter carries the scores). Wednesday and Thursday: ASML's and TSMC's quarters. Ten days on: Brazil's runoff. The ten-year opens at 5.24%, the ten-year real yield at 2.91%, the dollar at its high, the euro at its low, the world ex-US three cents under its line.
5 · The ETF Portfolio — Global ETFs
Global ETFs — 16 positions · unrealized +10.0% · benchmark Nasdaq-100 · snapshot Oct 9, 2026
| # | Symbol | Name | Weight | Unreal. |
|---|---|---|---|---|
| 1 | VEU | — | 10.9% | +4.4% |
| 2 | QQQM | — | 9.0% | +4.0% |
| 3 | SMHX | — | 8.9% | +50.4% |
| 4 | XLK | — | 8.7% | +7.4% |
| 5 | QTOP | — | 7.0% | +35.9% |
| 6 | EWT | — | 6.7% | +14.6% |
| 7 | SPMO | — | 6.6% | -4.0% |
| 8 | TOPT | — | 6.3% | +37.6% |
| 9 | ILF | — | 5.6% | +7.6% |
| 10 | IBIT | — | 5.4% | +26.0% |
| 11 | INDA | — | 5.4% | -11.2% |
| 12 | EWY | — | 5.2% | -4.1% |
| 13 | EPOL | — | 5.1% | +8.6% |
| 14 | FLSW | — | 4.8% | -5.5% |
| 15 | GLD | — | 4.5% | -3.0% |
+ 1 more position · full per-position cost basis & P&L is C+ subscriber-only.
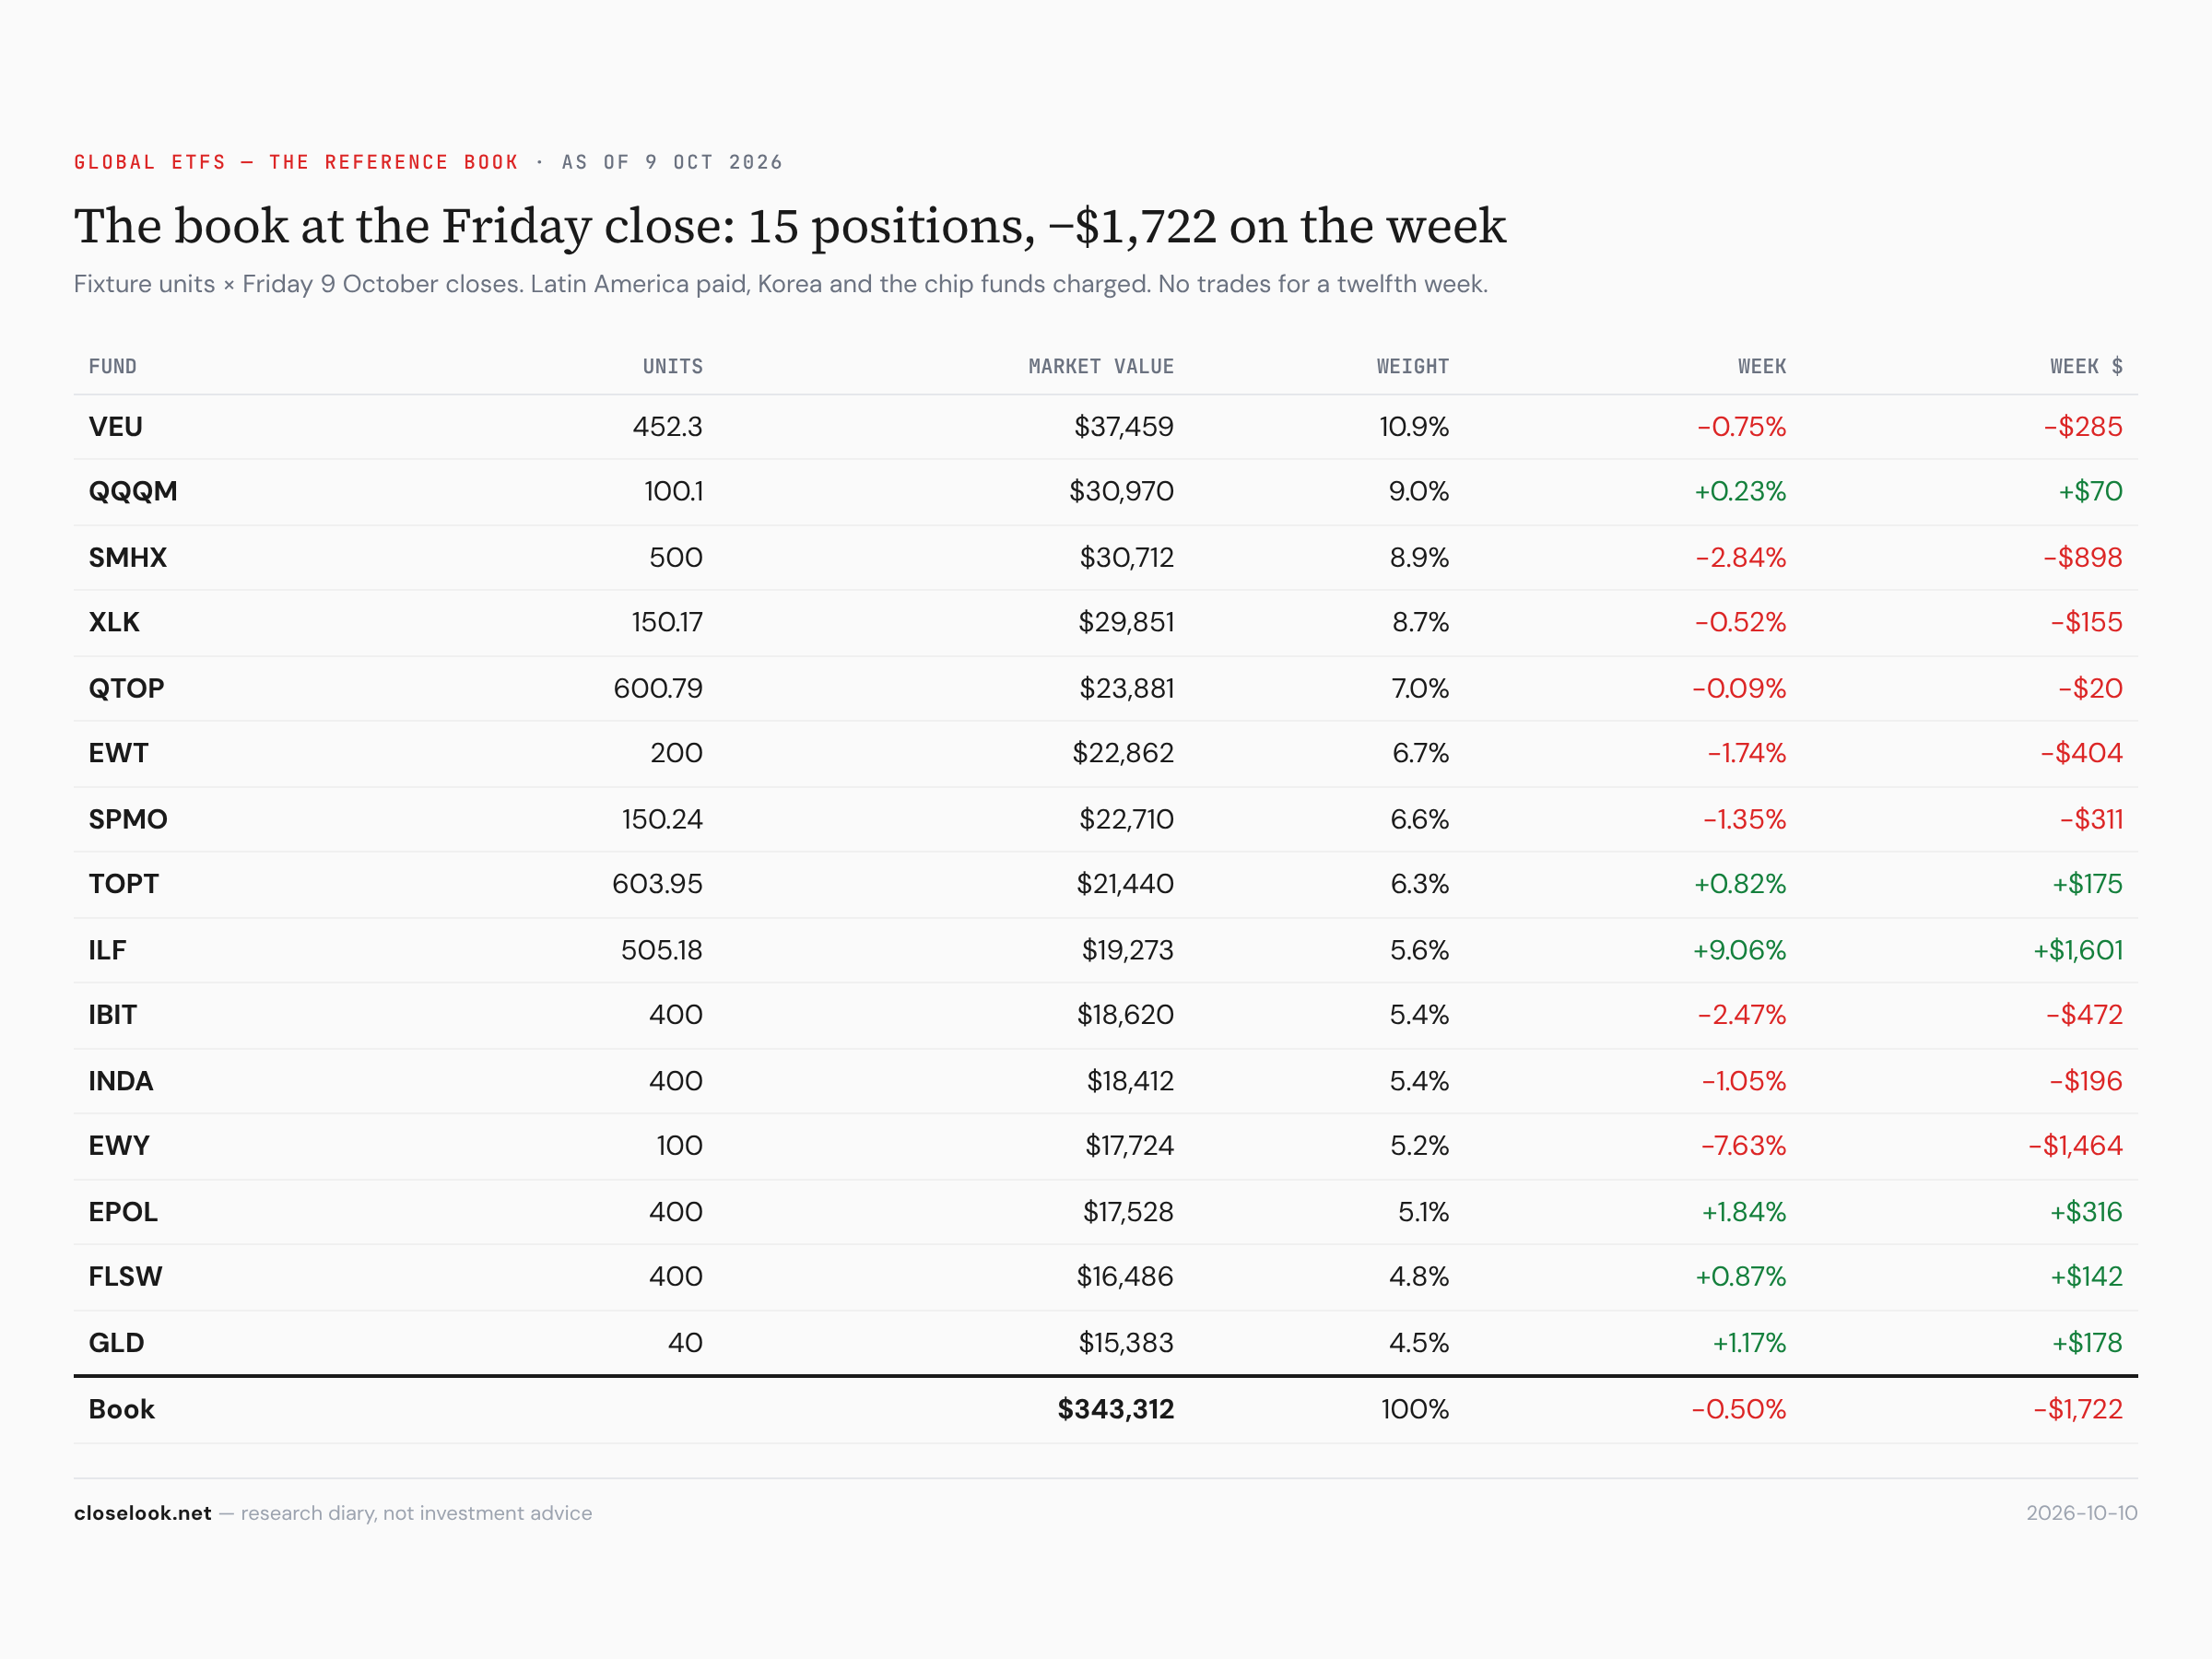
What we did this week: nothing — a twelfth consecutive week without a transaction, and no dividends inside the week. The July rebuild remains the decision. Saturday's Pulse carries the equity books' ledger: no buys or sells in any of the five books, dividends from SK Hynix, TSMC and Kulicke and Soffa, and a two-for-one split in Ibiden's ADR.
The book, marked — the $1,722 week. The fifteen-position book closed Friday at a market value of $343,312 — down $1,722, or 0.50%, from $345,034 at last Friday's closes on this week's units. Unrealized gains +10.04% on cost, from +10.59%; realized gains unchanged at $42,599; a headline return of about +29.6% on the $250,000 deposited. Six of fifteen lines green, nine red.
What the week paid it — and what it charged. Latin America +9.06% (+$1,601, the book's best by far), Poland +1.84% (+$316), gold +1.17% (+$178), the US top-20 line +$175, Switzerland +$142, QQQM +$70. The charges: Korea −7.63% (−$1,464, the book's worst), the fabless chip fund −2.84% (−$898), the bitcoin fund −2.47% (−$472), Taiwan −1.74% (−$404), US momentum −$311, VEU −$285, India −$196, XLK −$155, the Nasdaq top-30 line −$20. Last week the corridor paid and the rest charged. This week the corridor charged — about $2,800 from Korea, Taiwan and the fabless fund — and the one line that owns Brazil paid more than half of it back.
What we plan to do: nothing on Monday — with the same line under review. The book's European exposure is Poland and Switzerland; Switzerland stays the line the map no longer supports, even after a green week. The Latin America fund, 5.6% of the book, is a regional holding, not a call on an election — it stays as it is. The watch-items are the levels above — VEU against 82.85 from below, Korea against 190.11 from below, the bitcoin fund against 44.5, gold under 391.74, ASML and TSMC for Taiwan and the fabless fund. The book is 34% in the fabless chip fund, XLK, QQQM and the Nasdaq top-30 line, 12% in Korea and Taiwan, and 11% in the world ex-US.
The four tradable books, open for inspection. Alongside the reference portfolios documented on this site, the four Closelooknet-companion wikifolios — the tactical stock book, the AI-cycle thesis book, the ETF distribution core, and the non-tech growth compounder — publish their own ledgers on the wikifolio platform: every transaction in each of the four is visible there, trade by trade, at Closelooknet, AI Cycle 2030, ETF Generation and The Compound. How the vehicles work, and who the issuer is, lives on the Trade the Look page. Nothing here is a recommendation; this is a research diary.
6 · What May Go Wrong
One: the capex question spreads. This week the market asked whether AI's buyers will earn enough to keep buying, and sold the builders. If ASML's or TSMC's outlook for 2027 is cautious on the 14th or 15th, the question becomes an answer — and the sellers, who rose this week, depend on the same customers' budgets. A week in which software falls with the chips is the sign the rotation has become a retreat.
Two: real yields keep rising while earnings weaken. Real yields at their highest since 2008 are a headwind the market has carried because earnings kept rising. If the first reports cut next year's numbers while the TIPS yield climbs through 3%, the table in §7 moves to its worst row. The ten-year real yield above 3% on a weekly close, with the equal-weight S&P lower, is that week.
Three: Brazil's runoff reverses the first round. A 1.9-point lead is not a result. The 14% week priced one outcome of 25 October; the other is not in the price. Brazil is 5.6% of this book through the Latin America fund.
Four: the dollar turns. The stay-home case has been helped all year by a firmer dollar, and this week it helped again. A dollar that rolls over — on a run of weak US data or a policy push for a weaker currency — would hand the year back to the rest of the world quickly. The dollar fund back under its 50-day average on a weekly close is the first sign.
Five: France becomes Europe's problem. The spread stopped widening this week at 138 basis points; it did not narrow. A second leg would reach the banks that hold the bonds — and global financials are already five weeks under their line.
7 · Knowledge Corner
Real yields — why the level is not the signal. A real yield is what a government pays to borrow above inflation; the ten-year US Treasury inflation-protected bond (TIPS) quotes it directly. It matters for stocks because a share's value is its future profits discounted back to today, and the real yield is the base of that discount rate: the higher it is, the less a dollar of profit in 2030 is worth now. This week the ten-year real yield touched 2.95%, the highest since November 2008. That is a headwind for valuations — but not, on its own, a top or a bottom signal.
What decides is three things together: the level, the direction, and why yields are changing. Higher discount rates reduce the value of future profits, but stronger expected earnings can offset that pressure — research separates real-rate moves driven by growth from those driven by discount rates. The four combinations:
| Real yields | Earnings and growth | What it usually means for stocks |
|---|---|---|
| High and still rising | Unchanged or weakening | Pressure on valuations — the bearish case |
| Rising because growth and productivity improve | Expectations rising | Mixed — stocks can rise alongside yields |
| Peaking and falling | Resilient | Bullish — it can help put in a bottom |
| Falling because recession risk rises | Expectations deteriorating | Not a reliable buy signal — stocks can keep falling |
Where 2026 sits. For most of the year the second row: real yields rising, and earnings — above all the AI build-out's — rising faster. This week the direction flattened (2.92% to 2.91%) and, for the first time, the market questioned the earnings at the top of the build-out. That is the move to watch: from the second row toward the first if earnings expectations fall while yields stay high, or toward the third if yields peak while earnings hold. A peak in real yields with earnings intact has historically been one of the better turning points for equities. A fall in real yields because a recession is coming has not.
8 · Final Words
Brazil voted, and its fund rose fourteen percent. Latin America, China and Hong Kong rose with it. The chip corridor that carried the quarter gave back its week — Korea down almost eight percent, Taiwan off a record, the memory trade under its line — as the AI money moved from the companies that build to the companies that sell. Software rose, chips fell, and in America the average stock beat the Nasdaq.
The world ex-US index closed three cents under its structural line, and America now leads it for the year. The dollar made another high, the euro its low of the year. The ten-year real yield touched its highest since 2008. TSMC's September sales passed the test this letter set for them, and the corridor fell anyway — the market has started asking about next year.
The map holds: stay home, because America owns both halves of the AI trade; avoid mainland Europe's core; watch Brazil's runoff on the 25th. The stance holds too: buy the dips the next two weeks may offer, do not chase — and let ASML and TSMC say whether this week's dip was the first one or the start of something larger.
Price is the only truth. This week it said: the AI trade is still the trade, but it has moved up the stack. The weekly closes — 82.85 on the world ex-US, 190.11 on Korea, 83,000 on the coin, 391.74 on gold, 3% on the real yield — will say how far.