Markets
Where markets stand
Stoxx 600 and FTSE shown via their iShares trackers — EODHD carries no live index code for either.
Duration ladder rather than a yield print — the live 10-year yield is not on either data plan.
Front-month futures, delayed quotes; US contracts NYMEX/ICE, TTF is the Dutch gas benchmark in EUR/MWh.
Dollar index read via the UUP tracker — DXY itself is not carried on either data plan.
The future is live; the ETF marks are the last extended-hours print, not a live quote.
As of 06:17 UTC Indicative levels · not a trading feed
Systematic Market Intelligence
Money Temp 61 Rubin 2,005 40 dispersion cuts — signals today


Live channel STREAMING
Just happened on closelook
- PRINT RECORD Print Record — JPMorgan Chase (JPM): 9/10 EPS beats, 9/10 revenue, into the 2026-10-13 print
- PRINT RECORD Print Record — Goldman Sachs (GS): 10/10 EPS beats, 9/10 revenue, into the 2026-10-13 print
- PRINT RECORD Print Record — UnitedHealth (UNH): 8/10 EPS beats, 5/10 revenue, into the 2026-10-13 print
- PULSE Banks — More Profit, Still Not Enough
- MORNING 10 The Morning 10 — Korea is the story this morning.
- WIRE This week Agentic Winners 40 set the pace (-0.1%) while Rubin Build-Out fell (-2.4%)
- ANALYST Truist Securities set target on META → $1000 (+34.6%)
- ANALYST Bank of America Securities initiated SE → Buy
- EARNINGS SGMOQ missed (-1700%) — EPS −$0.08 vs $0.01 est
- EARNINGS GS beat (+32.3%) — EPS $17.01 vs $12.86 est
- MIDDAY 10 The Midday 10 — More of the same from last week.
- PULSE Earnings Week — Banks First, Then the AI Test
- WIRE This week so far (through Oct 12): the S&P 500 fell -0.1% — with the average stock holding up better
- WIRE This week's money went to energy and household staples; tech lagged
- WEEKLY Financials — The Early Warning Has Turned, for Now
- NEWSLETTER S&P 500 — The Market Trades a Rate Peak, and the Rally Broadens
- NEWSLETTER AI Stocks — The Flow Came True. The Builders Fell, the Sellers Rose
- COMMENTARY Portfolios — No Trades as Chips Fell 5%
- COMMENTARY Storage — Western Digital Sold the Day Before a 10% Drop, SanDisk Doubled
- NEWSLETTER The Hike Came and the Bull Held — Sold on the Sort, Bought on the Decision
The AI build-out, tracked like a book — five proprietary indices, a daily ten-point read, and calls that get scored in public.
- Five proprietary indices, recomputed daily
- Every Weekly Signal scored in public
- Real portfolios — cost basis, P&L, trade log
- An investment diary, not advice
Top stories
The latest from the desk

The Rhythm AUTO
Four reads, one system
The morning map, the midday tape, the day live, the week's one signal — the Morning 10 at 08:00 CET, the Midday 10 at 12:30 ET, the Daily Pulse through the trading day, the Weekly Signal on Sunday at 21:00 CET.
Korea — Kospi −5.5% breaks its 18-month uptrend; SK Hynix and Samsung about −8% on a China memory scare
Korea is the story this morning.5% at 6,035, after falling as far as about 5,914 and briefly below 6,000 — enough to trigger the exchange's sell-side curb on computer-driven trading for the first time in about two months.
Read today’s 10 →
The Midday 10 · trading days 12:30 ET
Ten lines on the US midday tape — movers, the board, the levels.
Read the Midday 10 →
Daily Pulse · every trading day
Banks — More Profit, Still Not Enough
Read the Pulse →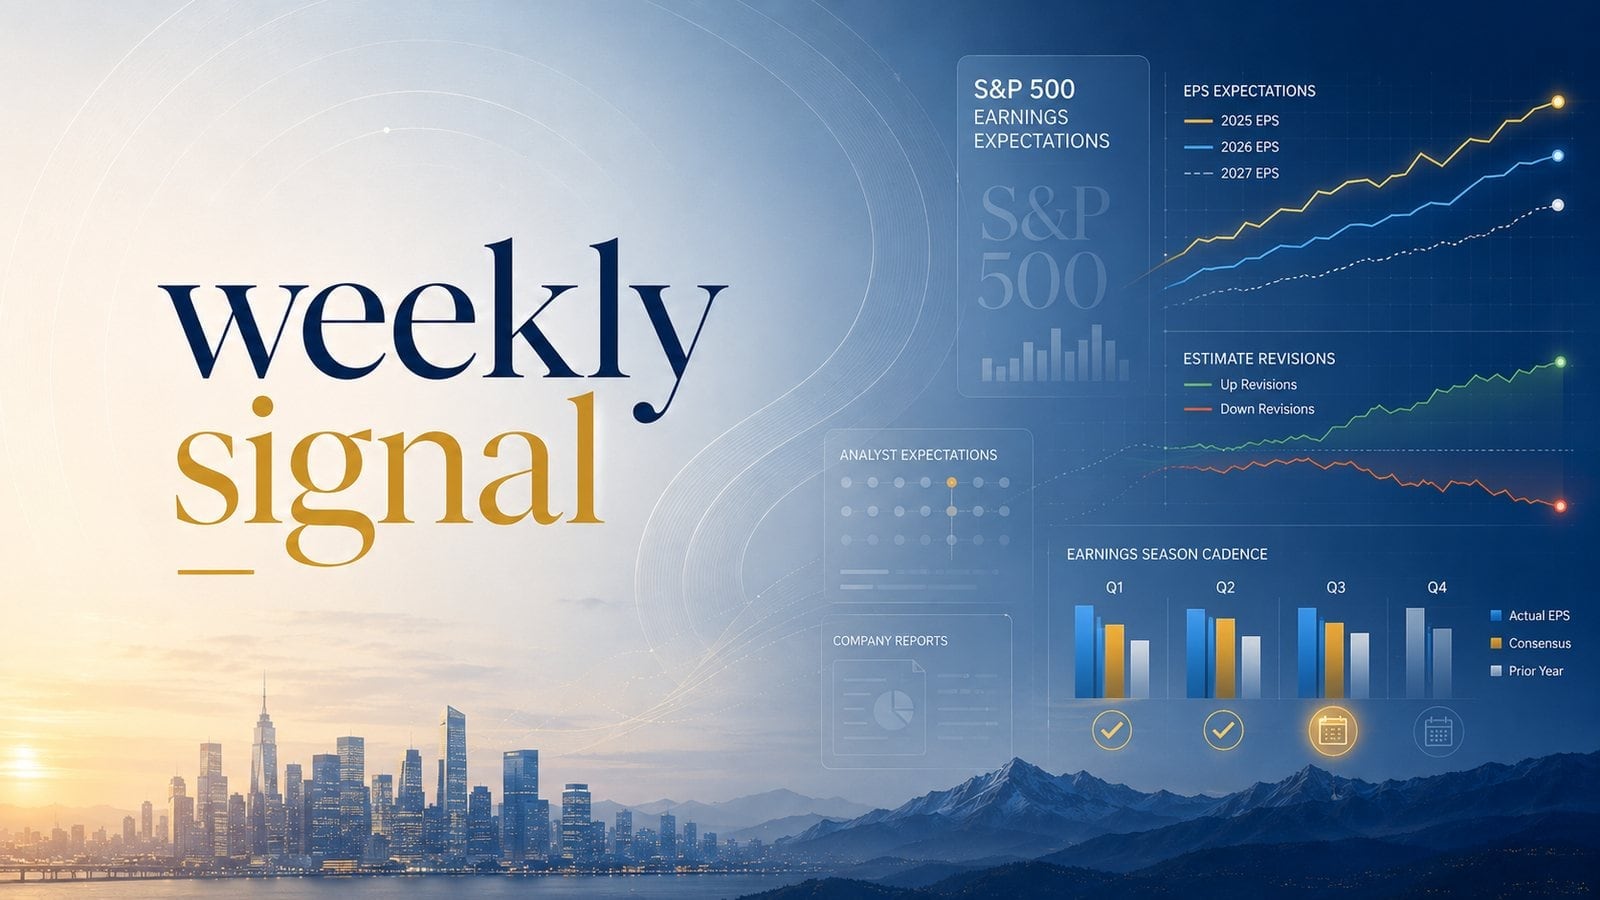
Weekly Signal · Sundays 21:00 CET
Financials — The Early Warning Has Turned, for Now
One signal to define the week →Signal reads · this week so far (through Oct 12)
The week on the board
Every number below is the Monday-to-Friday week, measured against the week before — refreshed nightly, each card linked to the full surface. Longer-horizon reads live in the Lab.
- The Market This week so far (through Oct 12): the S&P 500 fell -0.1% — with the average stock holding up better Open the full read →
- Closelooknet Indices This week Agentic Winners 40 set the pace (-0.1%) while Rubin Build-Out fell (-2.4%) Open the full read →
- Sectors This week's money went to energy and household staples; tech lagged Open the full read →
- Inside Tech Broad software led tech this week (-1.2%) Open the full read →
- Cross-Asset Oil rose 1.9% this week — a bigger weekly move than the stock market's Open the full read →
- Breadth 41% of S&P 500 stocks ended the week above their 50-day trend, up from 35% a week earlier Open the full read →
- Trend Engine AT&S holds the week's strongest trend score Open the full read →
Rubin · Functional Index LIVE
Rubin Build-Out 100 — the AI-infrastructure tape
Closelooknet's flagship functional index — 130 names across 24 sub-sectors of the AI data-centre build-out, from lithography and memory to power, construction, and physical AI. Four index variants (equal, cap, momentum, active momentum) and a live sector heatmap so the dominant rotation is visible at a glance. Recomputed every US close.
Indices · AI Board
Which AI layer is getting stronger?
Most Rubin names are losing strength (110 of 126); most Ecosystem names are getting stronger (22 of 34); most Winners names are getting stronger (33 of 40). On the week Winners +2.1%, Ecosystem −1.4%, Rubin −6.9%. Closes through 12 Oct.
Signal · Global tech LIVE
What's hot in global tech
The day's signals across the US, Europe and Asia — new highs, breakouts, analyst gaps and breadth — ranked into one board, in native currency. Tech only, global by construction. A diary, not advice.
Signal · Analyst Wire LIVE
What the Street just changed
Every US sell-side upgrade, downgrade and price-target move — newest first, each paired with our read: do we track the name, and where it sits on its 50/200-day. Refreshed through the day.
- Target CHDN Citizens on Updated EBITDA Estimates → $131 (+62.7%)
- Target CTRE Market Outperform by Citizens → $44 (+20.1%)
- Target MMED Rothschild & Co Redburn → $30 (+59.6%)
- Target PENN Market Outperform by Citizens → $26 (+68.8%)
- Target CYRX BTIG → $26 (+54.4%)
- Target META Truist Securities → $1000 (+34.6%) AW40
Functional Indices · The Barbell LIVE
The Closelooknet barbell — four sides of the AI trade
One thesis in four functional indices: Rubin tracks what builds the AI factory, Agentic what operates it, Agentic Winners who captures the value, and HALO what AI can't touch. Together they turn the AI build-out into a measurable, decomposable tape — equal-weight levels recomputed every US close.
Lab · AI Handoff Board
Where AI's value is moving — build, operate, use
Nine ratios of our own indices track the handoff from building the AI factory (Rubin) to operating it (Agentic Infrastructure) to living off it (Winners). Every ratio incepted at 1.00 on 2026-06-30; closes through 2026-10-13.
Lab · Mag Pulse
Is the hyperscaler cohort turning?
The Mag complex spent ~19 months sideways on capex fear. The board reads the turn daily: the hyperscaler cohort against the consumer-AI cohort, and the popular instrument against its standing levels. Closes through 2026-10-09.
Macro Dashboards · Leading LIVE
Structural Inflation — a leading monitor
Not a CPI mirror: a leading read on where US inflation pressure is heading and whether it is structural or a transitory shock. 26 FRED series across 7 buckets collapse into three gauges — how hot, heating or cooling, and real or noise.
Market Structure · Leading LIVE
Market breadth — how broad is the bull?
The index can sit near highs while only a handful of megacaps carry it. This reads the tape directly: of the ~500 S&P 500 names, how many actually participate — above their 200-day, the median stock's return, how many sectors are working.
Lab · Breadth LIVE
Breadth vs the sector
What the headline hides: are these moves broad, or carried by a few mega-caps? Median constituent vs the index, advancers vs decliners, and a cumulative advance/decline line that tends to turn before price.
Lead Indicators · macro · signal · lab
- MacroABR Regime58.4Risk-On broadening+0.4 W/WOpen →
- SignalPattern Engine5patterns activescanning post-closeOpen →
- Lab · LeadAgentic Demand Index74.58 of 8 pulses · equal-weightfamily aggregate (demand side)Open →
- Lab · LeadAI Build-Out Index55.34 of 4 indices · equal-weightfamily aggregate (supply side)Open →
About closelook.net
Intelligence, signals and portfolios — for global tech investing.
Daily market reads · proprietary functional indices · live model portfolios · real-time pattern signals · and the frameworks behind them.
closelook.net is an independent intelligence, signal and transaction platform for global technology investing. It publishes short-form and long-form editorial reads, proprietary frameworks, functional indices, regime monitors, live model portfolios and a real-time pattern-hit signal scanner.
Eight sections, one spine.
closelook.net is organised around eight connected sections — Pulse, Signal, Indices, Intel, Lab, Portfolios, Tape and Predictions ↗. Every section draws from the same data spine: the proprietary indices, the Money Temperature pipeline, the Pattern Engine and the Cointegration Monitor. Editorial contextualises moves; analysis produces the underlying scores; portfolios and predictions convert those scores into verifiable positions.
Closelooknet sits between a Bloomberg terminal and an investment newsletter — quant-desk methods packaged as free access and premium subscription for retail investors, boutique advisers and family offices.
What Closelooknet is → Browse the 101 series → Compare C+ tiers →
Pulse · Editorial AUTO
Latest editorial
Editorial cards that translate analysis into language: the Daily Pulse — a short pre-market summary published 08:30 New York; Heresies — short-form opinion against the consensus; the Weekly Signal — a Sunday trade call with full reasoning and invalidation; Reports — long-form structural research; the Newsletter — the Substack + LinkedIn long-form companion; and On That Day in Markets — a twice-weekly finance-history quiz.
-
Banks — More Profit, Still Not Enough
The first big earnings day of the season: JPMorgan and Wells Fargo earned more than a year ago and still fell short — JPMorgan missed on profit and revenue, Wells Fargo on revenue — and both traded about 2% lower before…
3 min -
Financials — The Early Warning Has Turned, for Now
One signal to define the week and shape the month. Three minutes, six questions. Every Sunday at 21:00 CET — scored the next. 11 October 2026 · stock and bond closes through Fri Oct 9. 0 · Last week, scored Verdict: the…
7 min -
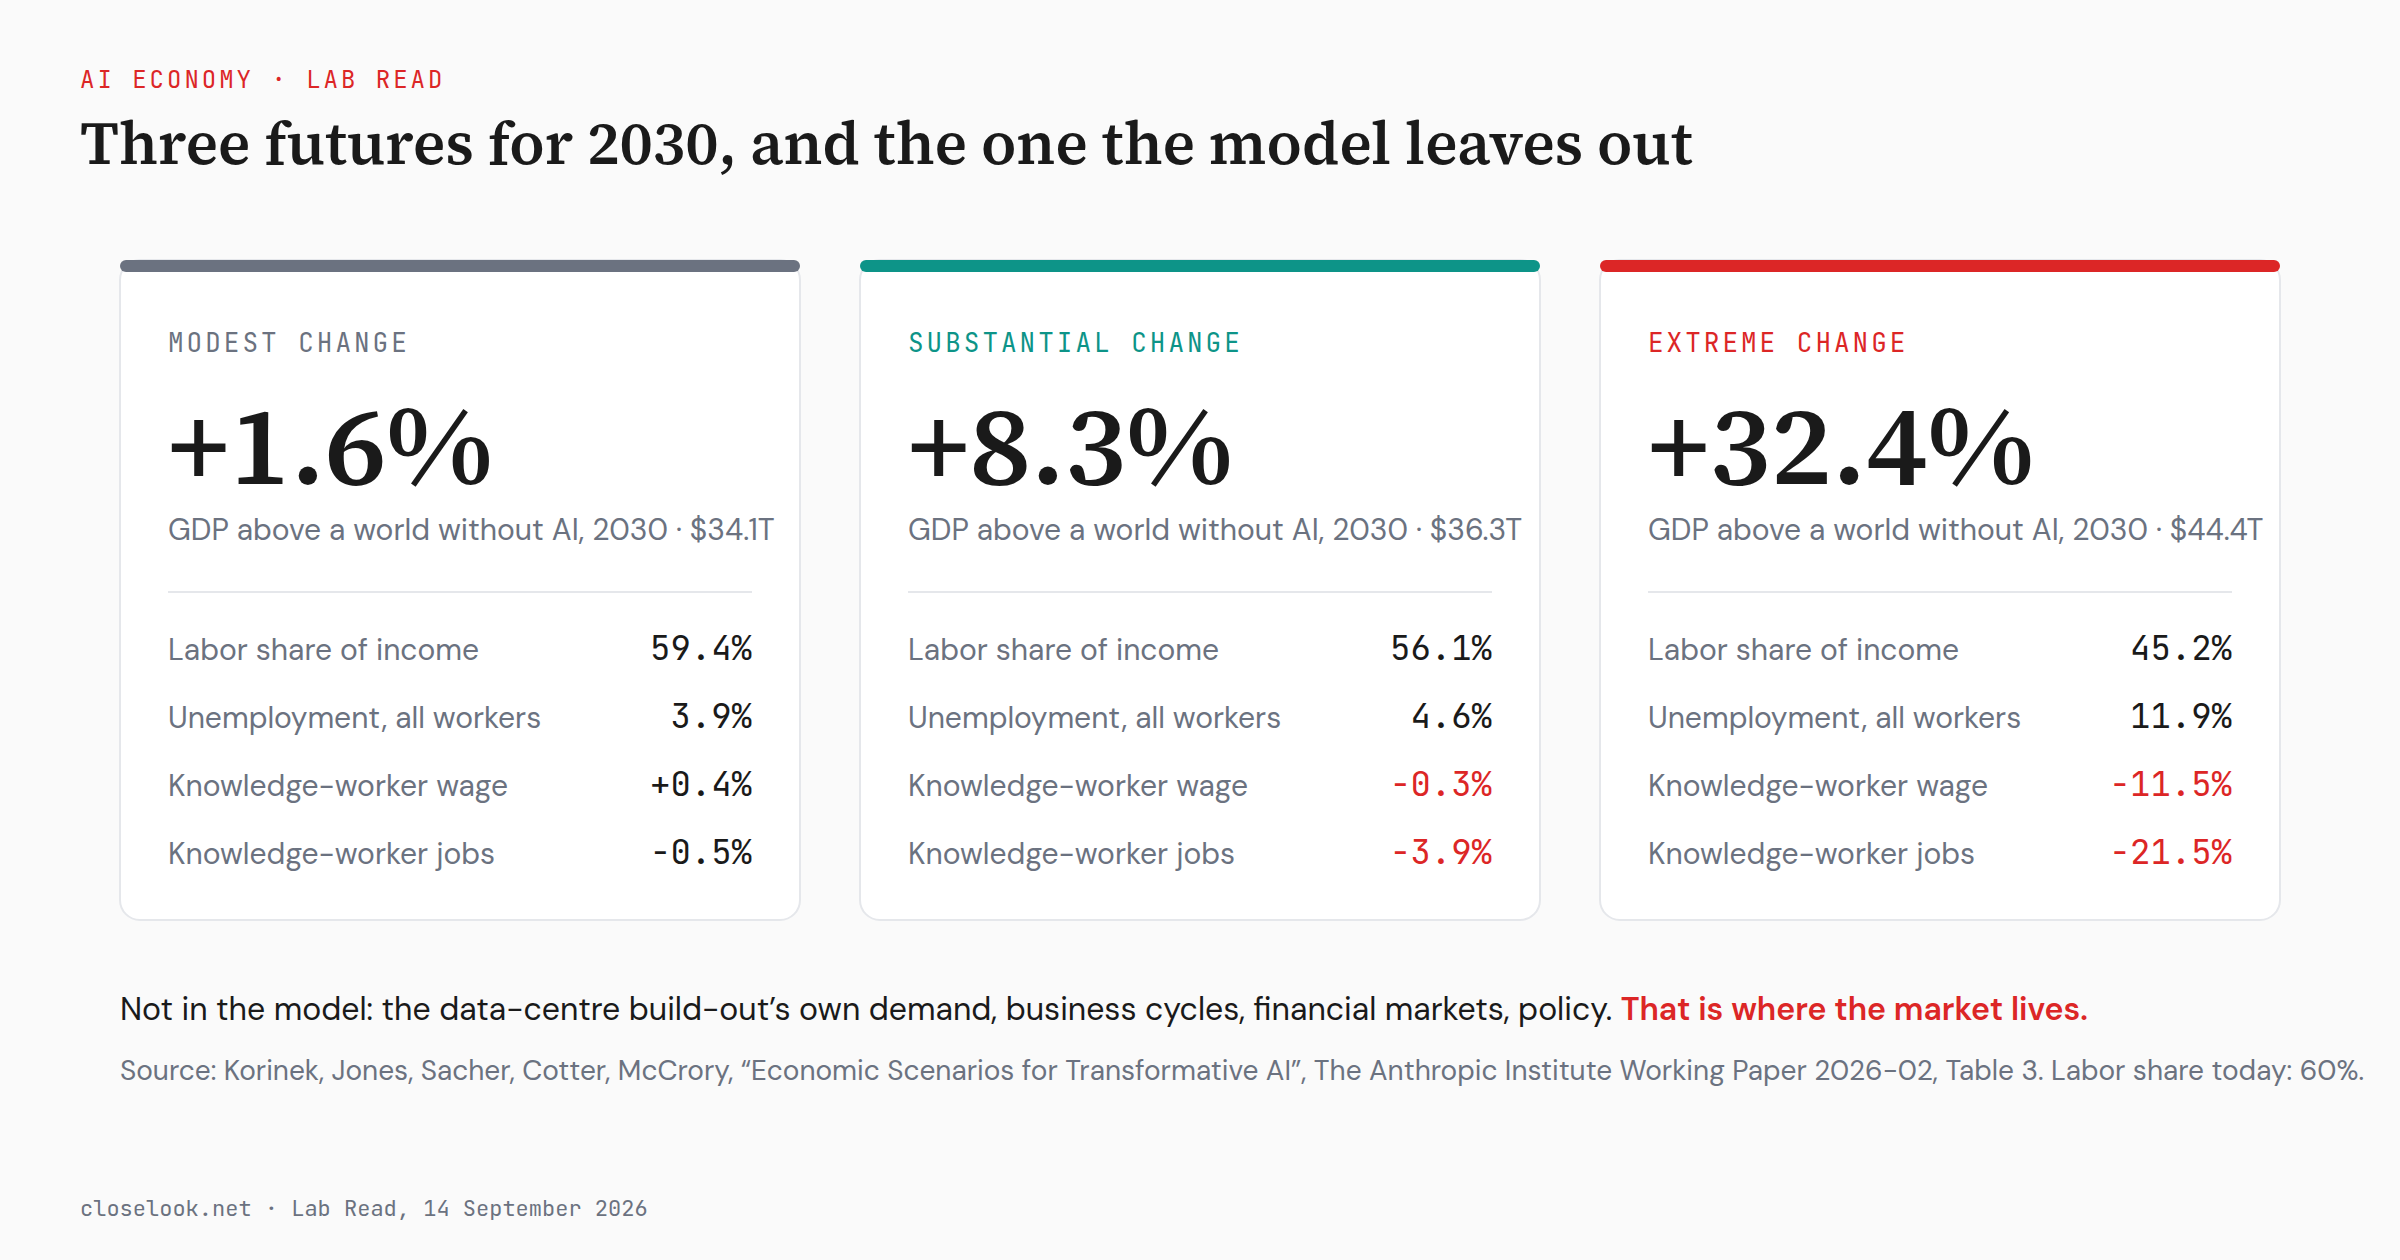
AI Economy — Three Futures for 2030, and the One the Model Leaves Out
Anthropic’s economists put numbers on modest, substantial and extreme AI: GDP, jobs, wages, the labor share. The build-out that the market prices is not in the model, and that is the read.
10 min
Pulse · Newsletter
Newsletter family
The long-form companion to the site — a Substack hub plus LinkedIn newsletters tailored to audience-specific frames: global stock markets, US stock markets and hypergrowth. Subscribe on the platform you already read.
-
Closelooknet
Investment research across the US and global markets. Technical analysis, Elliott Wave timing, and structural research mapping the AI buildout — from semiconductors to software. Hypergrowth stocks, global ETFs, and country-level supply chain intelligence.
Subscribe -
Closelook@US Stock Markets
Technical analysis of the US stock markets, trading signals and macro insights.
Subscribe -
Closelook@Hypergrowth
Building diversified portfolios of hypergrowth stocks for different risk levels and investment strategies.
Subscribe -
Closelook@Global Stock Markets
Global stock markets, ETFs, trading signals and macro insights.
Subscribe
Signal · Live signal log LIVE
Latest signals
Live: every Add, Reduce, Roll and Exit across the Closelooknet model portfolios, logged with the reasoning in plain English. SSR-seeds with the static fallback for first paint, then replaces with the freshest rows from /api/signals/trades. The Pattern Engine feed (proprietary patterns from the Directional Alpha framework) joins this page when the signal-ticker worker ships.
- Added BESVF AI Buildout May 30
Reasoning published in the next Daily Pulse, Weekly Signal, or Newsletter.
- Exited SIE.D.DX AI Buildout May 30
Reasoning published in the next Daily Pulse, Weekly Signal, or Newsletter.
- Exited BESI.NA AI Buildout May 30
Reasoning published in the next Daily Pulse, Weekly Signal, or Newsletter.
Indices LIVE
Functional indices
Proprietary indices built to uncover the narratives that drive markets beneath the surface — sector rotation, supply-chain shifts, smart-money positioning. Structured by function, not by SIC classification. Each index is recomputed nightly and evolves as the dominant themes change.
Intel · Reads / 101 / Glossary AUTO
Frameworks and briefs
The substance layer: plain-English 101 entries that explain the concepts behind our signals, glossary terms a quant desk would assume you know, and deep-research briefs on single themes. Every scoring decision on the site traces back to a framework documented here.
Lab · Quant dashboards LIVE
Lab status
Live quantitative dashboards — such as the Money Temperature gauge tracking macro regime shifts, the Cointegration Monitor flagging pair-trading breaks, and rotation trackers across our index families. Each tool publishes its raw data so you can reconstruct the score.
Money Temperature —
Cointegration —
SPY/GLD · QQQ/SPY · BTC-USD/QQQ +4 more
Open →Pattern Engine live
Latest: Asia close: Nikkei -2.17%, KOSPI -6.78% — KOSPI -6.8% drags Asia · US close: S&P -0.08%, NDX -0.47% — KOSPI -2.6% drags Asia
Open →AW40 · Agentic —
Agentic Winners 40 against its benchmarks and the software/semis rotation.
Open →Lab · Sector Engine LIVE
Global sector heatmap
11 GICS sectors across 4 regions, refreshed daily. Cross-region spreads, cyclical-defensive rotation, and region-weighted globals — the decomposition that tells you whether a global sector move was actually global, or just one region carrying the average.
Leading sector globally —
Region-weighted across the 4-region matrix · 1-month window
Open →Lagging sector globally —
Region-weighted across the 4-region matrix · 1-month window
Open →Risk-on regime —
Strongest cyclical − defensive spread across regions · 1-month
Open →Portfolios · Model LIVE
Live model portfolios
Live reference portfolios — active discretionary baskets covering tech equities, thematic buildouts, global ETFs and derivatives, plus systematic Rubin trackers (Equal Weight, Momentum, Sector Rotation). Every position is visible daily, every change is logged. Skin in the game, scored against the same benchmarks you would use — no opaque sleeves, no hidden bets.
- Global Tech 50 49 positions Return +188.42%
- AI Buildout 34 positions Return +51.63%
- Hypergrowth 25 positions Return +30.24%
- Global ETFs 21 positions Return +29.91%
- Derivatives 11 positions Return +12.48%
- Rubin EW 102 positions Return +81.34%
- Rubin MW 102 positions Return +85.54%
- Rubin Sector 61 positions Return +2.71%
Tape · Live channel LIVE
Latest tape
Price-action news for the Closelooknet universe — surfaced from the noise. Bellwether multi-day flow, PEAD signals, watchpoint events and macro cards, posted continuously across the trading day.
The Trading Days
All days →Every trading day, kept as a permanent page — what the homepage looked like when it mattered.
- Tue, Oct 13 · today Korea — Kospi −5.5% breaks its 18-month uptrend; SK Hynix and Samsung about −8% on a China memory scare
- Mon, Oct 12 Korea — Kospi −3.5% on its first day back as chipmakers catch up; SpaceX deal sinks T-Mobile 13%
- Fri, Oct 9 AI Capex — chip index −3.4% after OpenAI's revenue comes in at $50 billion, not $70 billion; software rises
Predictions · Expert forecasts
Calibrated forecasts, not prediction markets.
Structured forecasts scored on accuracy, not opinion. Community, experts and AI each make their call — the scoreboard is public, the methodology transparent. Predictions closes the loop between intelligence, signal and outcome — it is where Closelooknet keeps itself honest.
Invited experts forecast binary finance questions — FOMC decisions, earnings beats,
macro moves, crypto levels. Scoring is Brier + log-loss, not cash. Runs on
predictions.closelook.net with its own Cloudflare worker and D1
database. Metaculus model, finance-vertical focus.
live
-
Macro Jul 2026 Will the Fed cut rates at the July 31, 2026 FOMC meeting?
-
Macro Jul 2026 Will the Bank of England cut rates at the August 1, 2026 MPC meeting?
-
Macro Sep 2026 Will the ECB cut rates at the September 10, 2026 Governing Council meeting?
-
Macro Sep 2026 Will the Fed cut rates at the September 18, 2026 FOMC meeting?
FAQ · Frequently asked
What Closelooknet is, in plain questions.
-
What is closelook.net?
- closelook.net is an independent research and signal platform for global technology investing. It publishes proprietary frameworks, functional indices such as the Rubin Build-Out 100, HALO Growth 100 and Euro-AI Sovereign 50, a Money Temperature regime monitor, a cointegration dashboard, five live model portfolios and a real-time pattern-hit signal ticker. Closelooknet sits between a Bloomberg terminal and an investment newsletter — quant-desk methods packaged as a subscription for retail investors, boutique advisers and family offices.
-
Who is closelook.net for?
- closelook.net is built for three audiences: clever retail investors who manage their own book, boutique advisers running client portfolios, and single or multi-family offices allocating across public tech equity. The common denominator is an investor who wants the transparency of systematic methods without the cost and complexity of a full trading desk. The site is in English with occasional German source material, and the tier structure is designed so that the free layer covers most self-directed users while paid tiers add real-time signals and deeper pattern detail.
-
What is the Money Temperature?
- Money Temperature is a regime monitor computed daily from eight macro instruments — US and German yield curves, the DXY dollar index, gold, oil, copper, credit spreads and implied volatility. Each instrument is scored on trend, cointegration stability and cross-market consistency using Engle-Granger and Hurst statistics. The composite score lands on a 0–100 scale and is rendered as one of three states: 🟢 calm, 🟡 transition or 🔴 stress. The pipeline runs at 23:05 UTC on GitHub Actions and writes its output to a Cloudflare R2 bucket. Live dashboard: Money Temperature lab.
-
What are functional indices?
- A functional index is a rules-based basket constructed around a specific economic function rather than a sector label. The Rubin Build-Out 100 tracks the equity expression of the AI data-centre build-out across 24 sub-sectors with a deliberate Asian weighting. HALO Growth 100 captures functional growth compounders across twelve sectors. Euro-AI Sovereign 50 isolates the European AI sovereignty theme. Because each index is constructed from a function rather than a market-cap float filter, the constituent list can cross traditional index boundaries and is rebalanced on disclosed rules.
-
How does the signal ticker work?
- The signal ticker is an agentic feed. A Cloudflare worker scans the proprietary data sources — the Money Temperature output, the four functional indices, the cointegration monitor and a live pattern library of 51 directional-alpha patterns — every few minutes. When a pattern fires on an instrument in the Closelooknet universe, an Anthropic-powered agent composes a short signal bite with confidence, temperature context and index weight. Bites are written to Cloudflare KV, exposed via
/api/signals, and rendered both as a scrolling strip and as a filterable feed. - The signal ticker is an agentic feed. A Cloudflare worker scans the proprietary data sources — the Money Temperature output, the four functional indices, the cointegration monitor and a live pattern library of 51 directional-alpha patterns — every few minutes. When a pattern fires on an instrument in the Closelooknet universe, an Anthropic-powered agent composes a short signal bite with confidence, temperature context and index weight. Bites are written to Cloudflare KV, exposed via
-
How is closelook.net different from Bloomberg, Reuters or a typical newsletter?
- Bloomberg and Reuters are horizontal — they cover everything at news-wire depth. Closelooknet is vertical: it covers one stack (global tech investing) with proprietary indices, proprietary patterns and its own regime models. A typical newsletter offers opinion without a data spine. Closelooknet offers both: every editorial piece links back to the data that justifies it, and every data view links forward to the editorial that contextualises it. Pricing reflects the positioning — a C+ Premier subscription at $89 per month sits between a newsletter and an institutional data contract.
Subscribe
Two ways to sign up
Join the Look free with one email — or go C+ for the money layer: every position with cost basis and P&L, the real-time trade log, the complete edition archive.
Join the Look
The free account — one email, no password.
The daily extra point on both 10-formats, all three newsletters in full on the page, the Weekly playbook and track record, the Print Record company pages, live market TV with the companion rail.
Join the Look — free →Free updates included — Daily Pulse + Weekly Signal in your inbox.