Closelook@Global Stock Markets
Global Markets — Brazil Jumps 14%, Korea Falls 8%, America Takes the Year Back
Brazil's fund jumped 14% after the first round of its election, and Latin America and China rose with it — while the chip markets that carried the quarter fell, Korea by 7.6 percent, as the AI trade moved from the companies that build it to the companies that sell it. Software rose, chips fell, and in America the average stock beat the Nasdaq. The world ex-US index closed the week three cents under its structural line, and for the first time this year America leads it for 2026. The dollar made another high close and the euro its lowest of the year; the ten-year real yield touched its highest since November 2008. TSMC's September sales passed the test this letter set for them — and the chip markets fell anyway.
Current edition · 2026-10-10
1 · This Week's Action
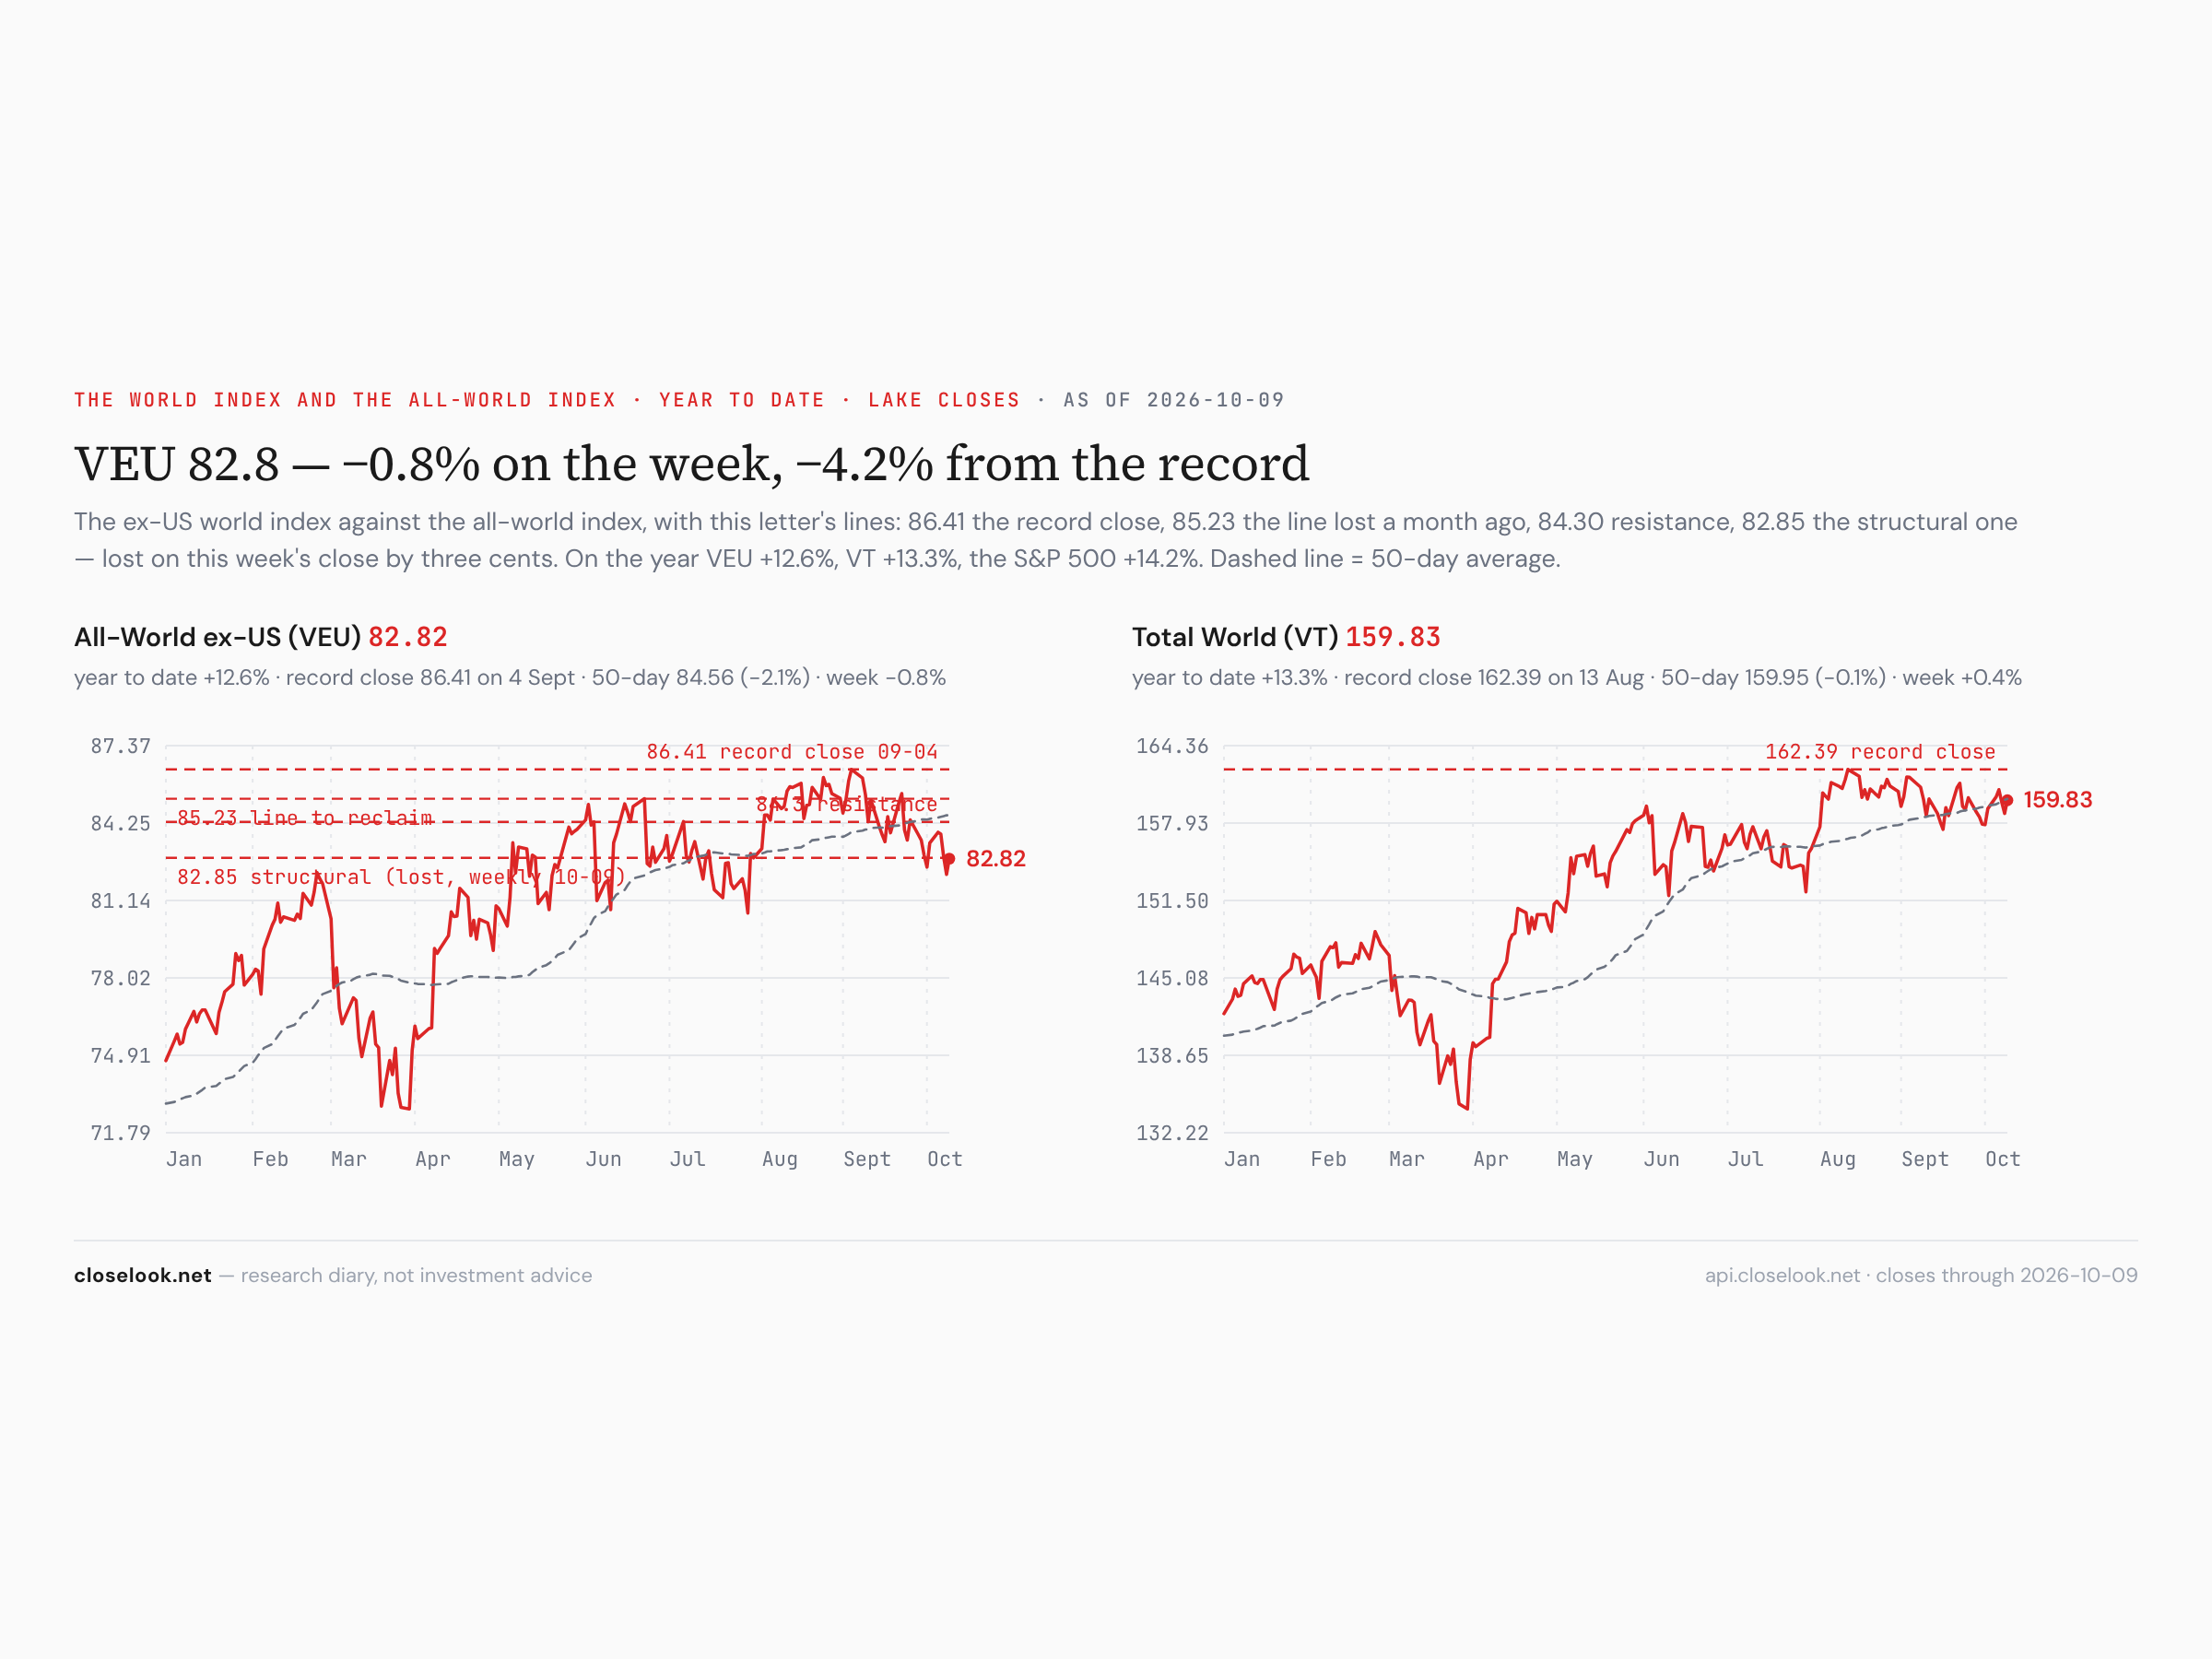
The global view. The ex-US world index closed the week at 82.82, down 0.75% — three cents under 82.85, the structural line this letter has carried since the summer, on a weekly close for the first time. The path: Monday 83.88, Tuesday 83.81, Wednesday 82.85 — on the line to the cent — Thursday 82.18, Friday 82.82. The index sits 4.2% under its September 4 record of 86.41. The all-world index rose 0.44% to 159.83. The S&P 500 fund rose 1.16% to 778.57, a record close on Tuesday at 779.09; the Nasdaq 100 fund rose only 0.23%.
The year changed hands. The S&P 500 fund is +14.2% for 2026, the all-world index +13.3%, the world ex-US +12.6%. A week ago the ex-US world led America for the year by six tenths of a point; it led by 4.5 points five weeks ago. This week America took the lead, by 1.6 points — the fifth stay-home week in a row, and the first in which the year's order reads America first. The house cointegration monitor still lists the VEU/SPY pair as breaking, the spread now 2.6 standard deviations below its mean.
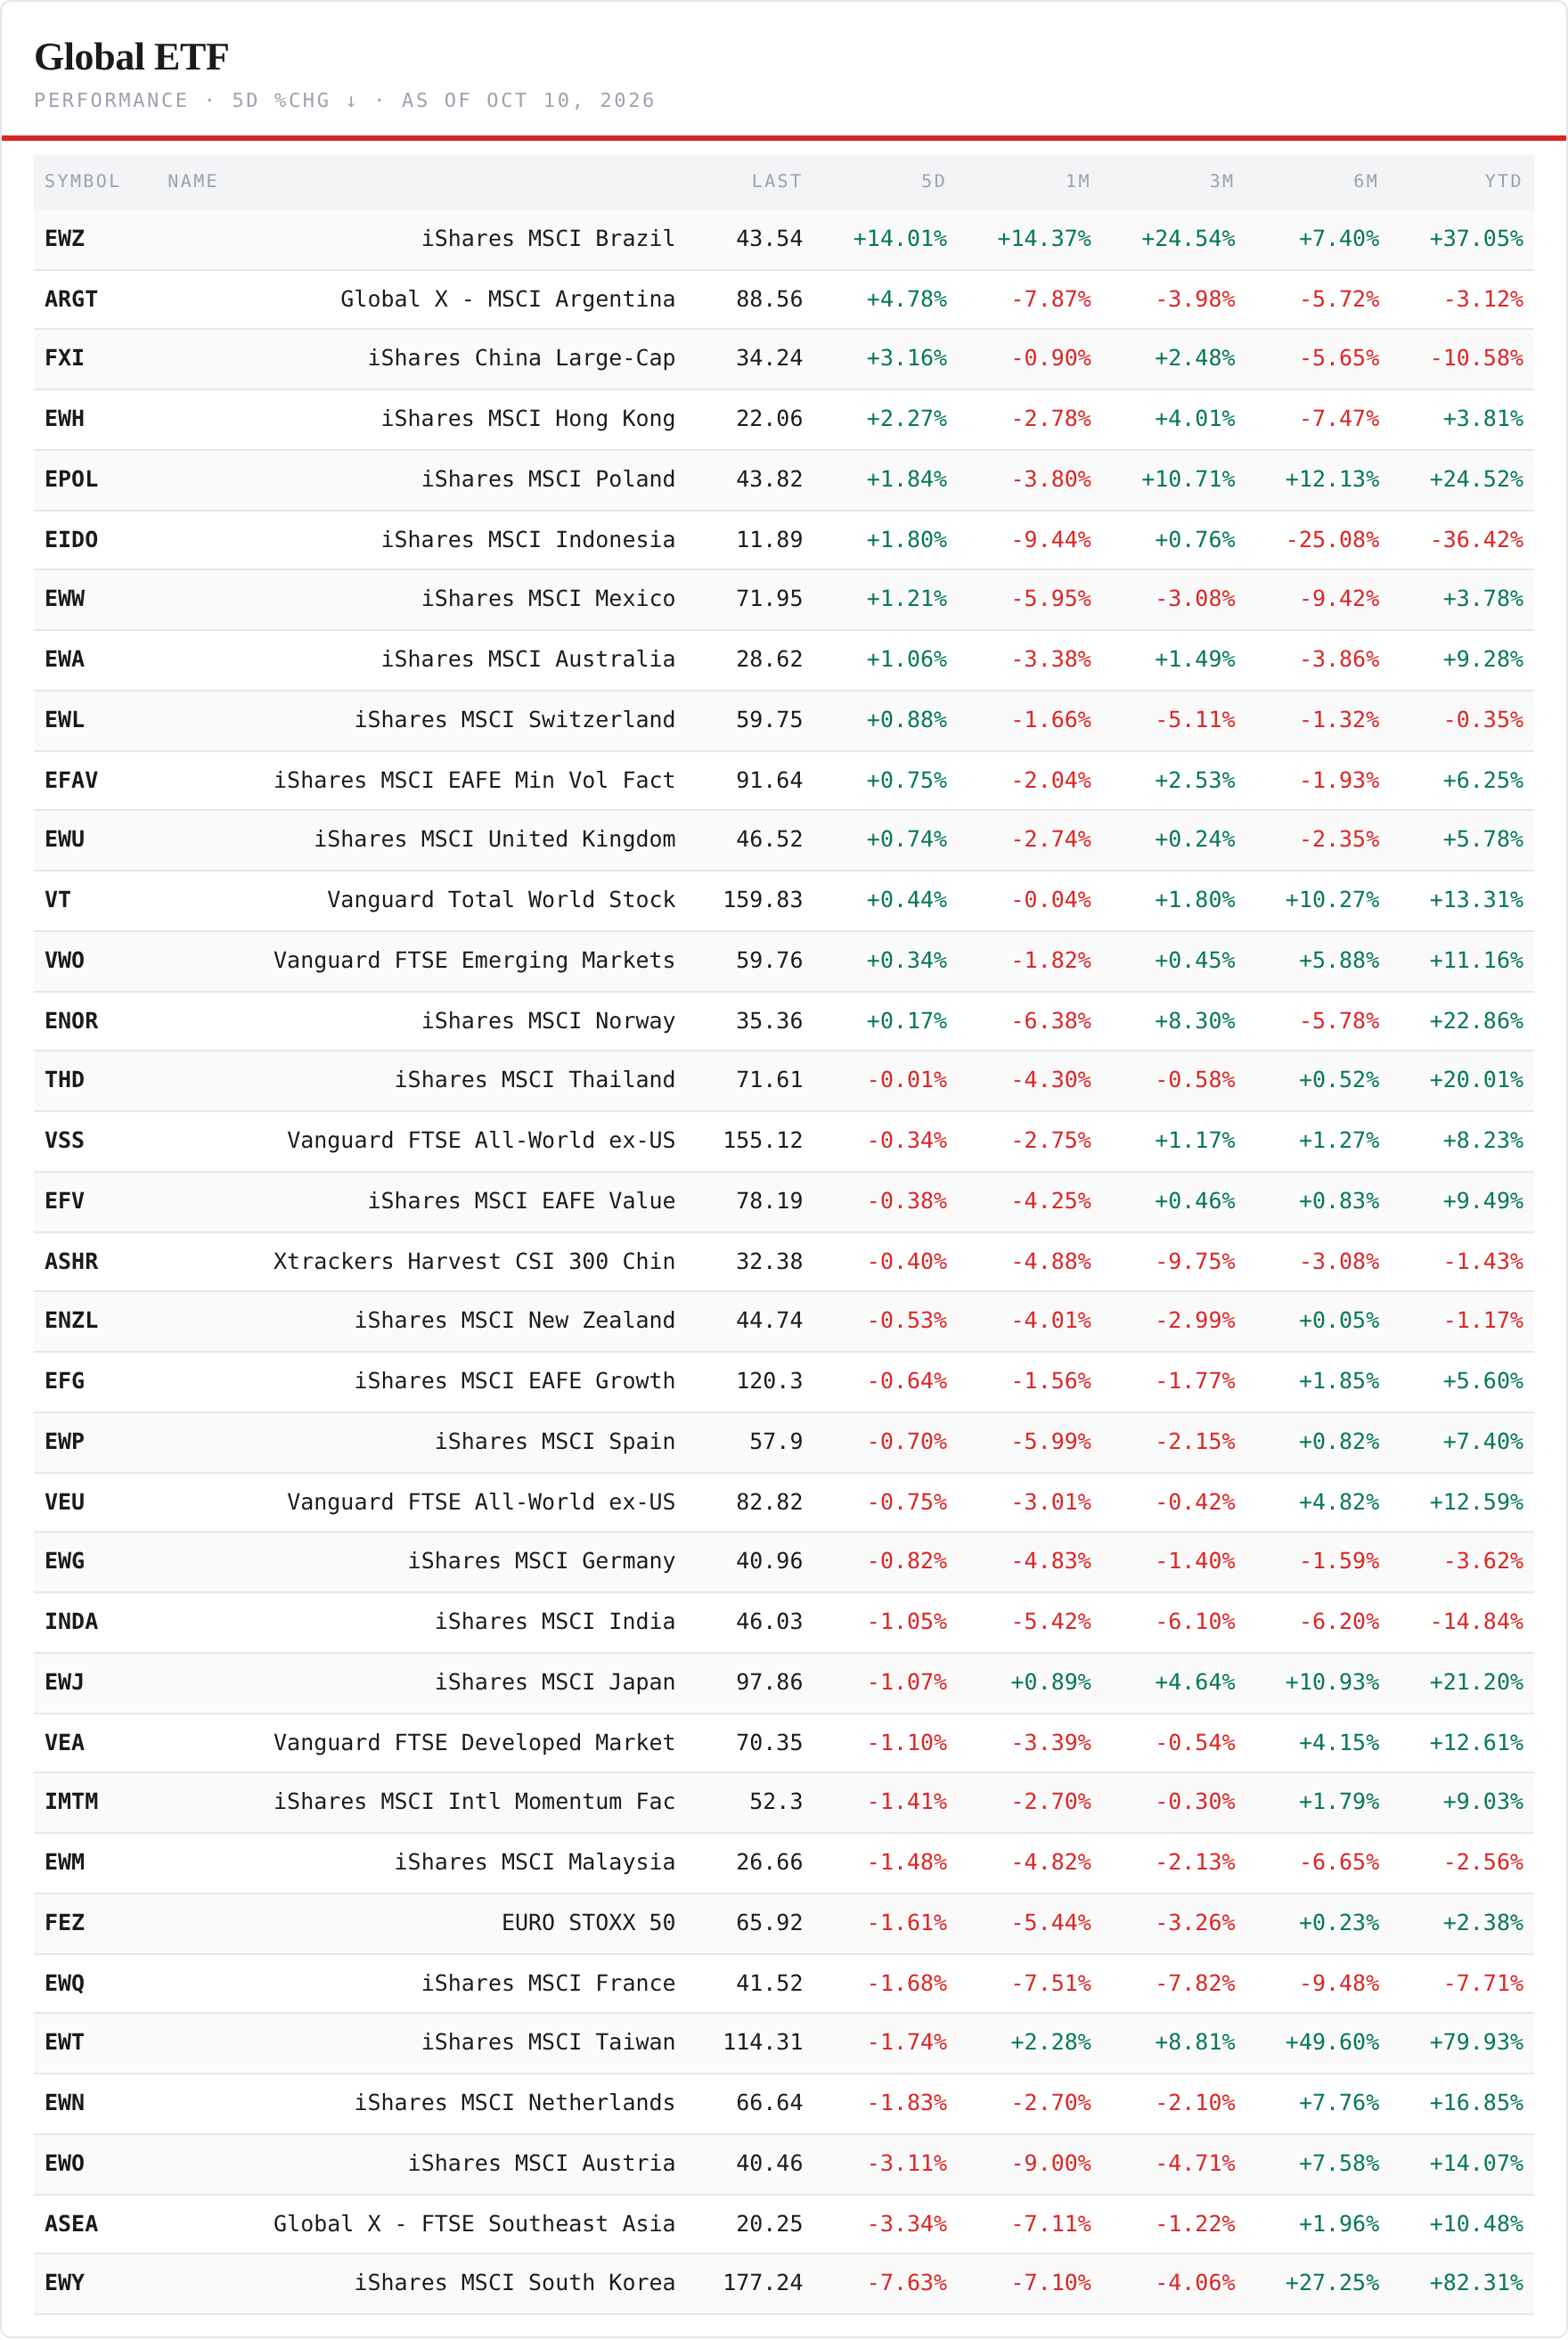
Brazil — the vote that moved a market. The week's largest move on the board had nothing to do with chips. Brazil held the first round of its presidential election on Sunday: Flávio Bolsonaro took 47.0% of the valid votes against 45.2% for President Lula, and the two go to a runoff on 25 October. On Monday São Paulo's Ibovespa rose 7.7% to 206,912, its first close above 200,000, led by the banks; in New York the Brazil fund EWZ rose 12.5% on the day, and 14.0% on the week to 43.54 — its highest close in a year, +37% for 2026. Investors read the result as a vote for tighter public finances. The Latin America fund rose 9.1%, Argentina 4.8%, Mexico 1.2%. One country's election did not change the AI map, but it did something the map rarely shows: it moved money into a market that owns no part of the AI build-out at all.
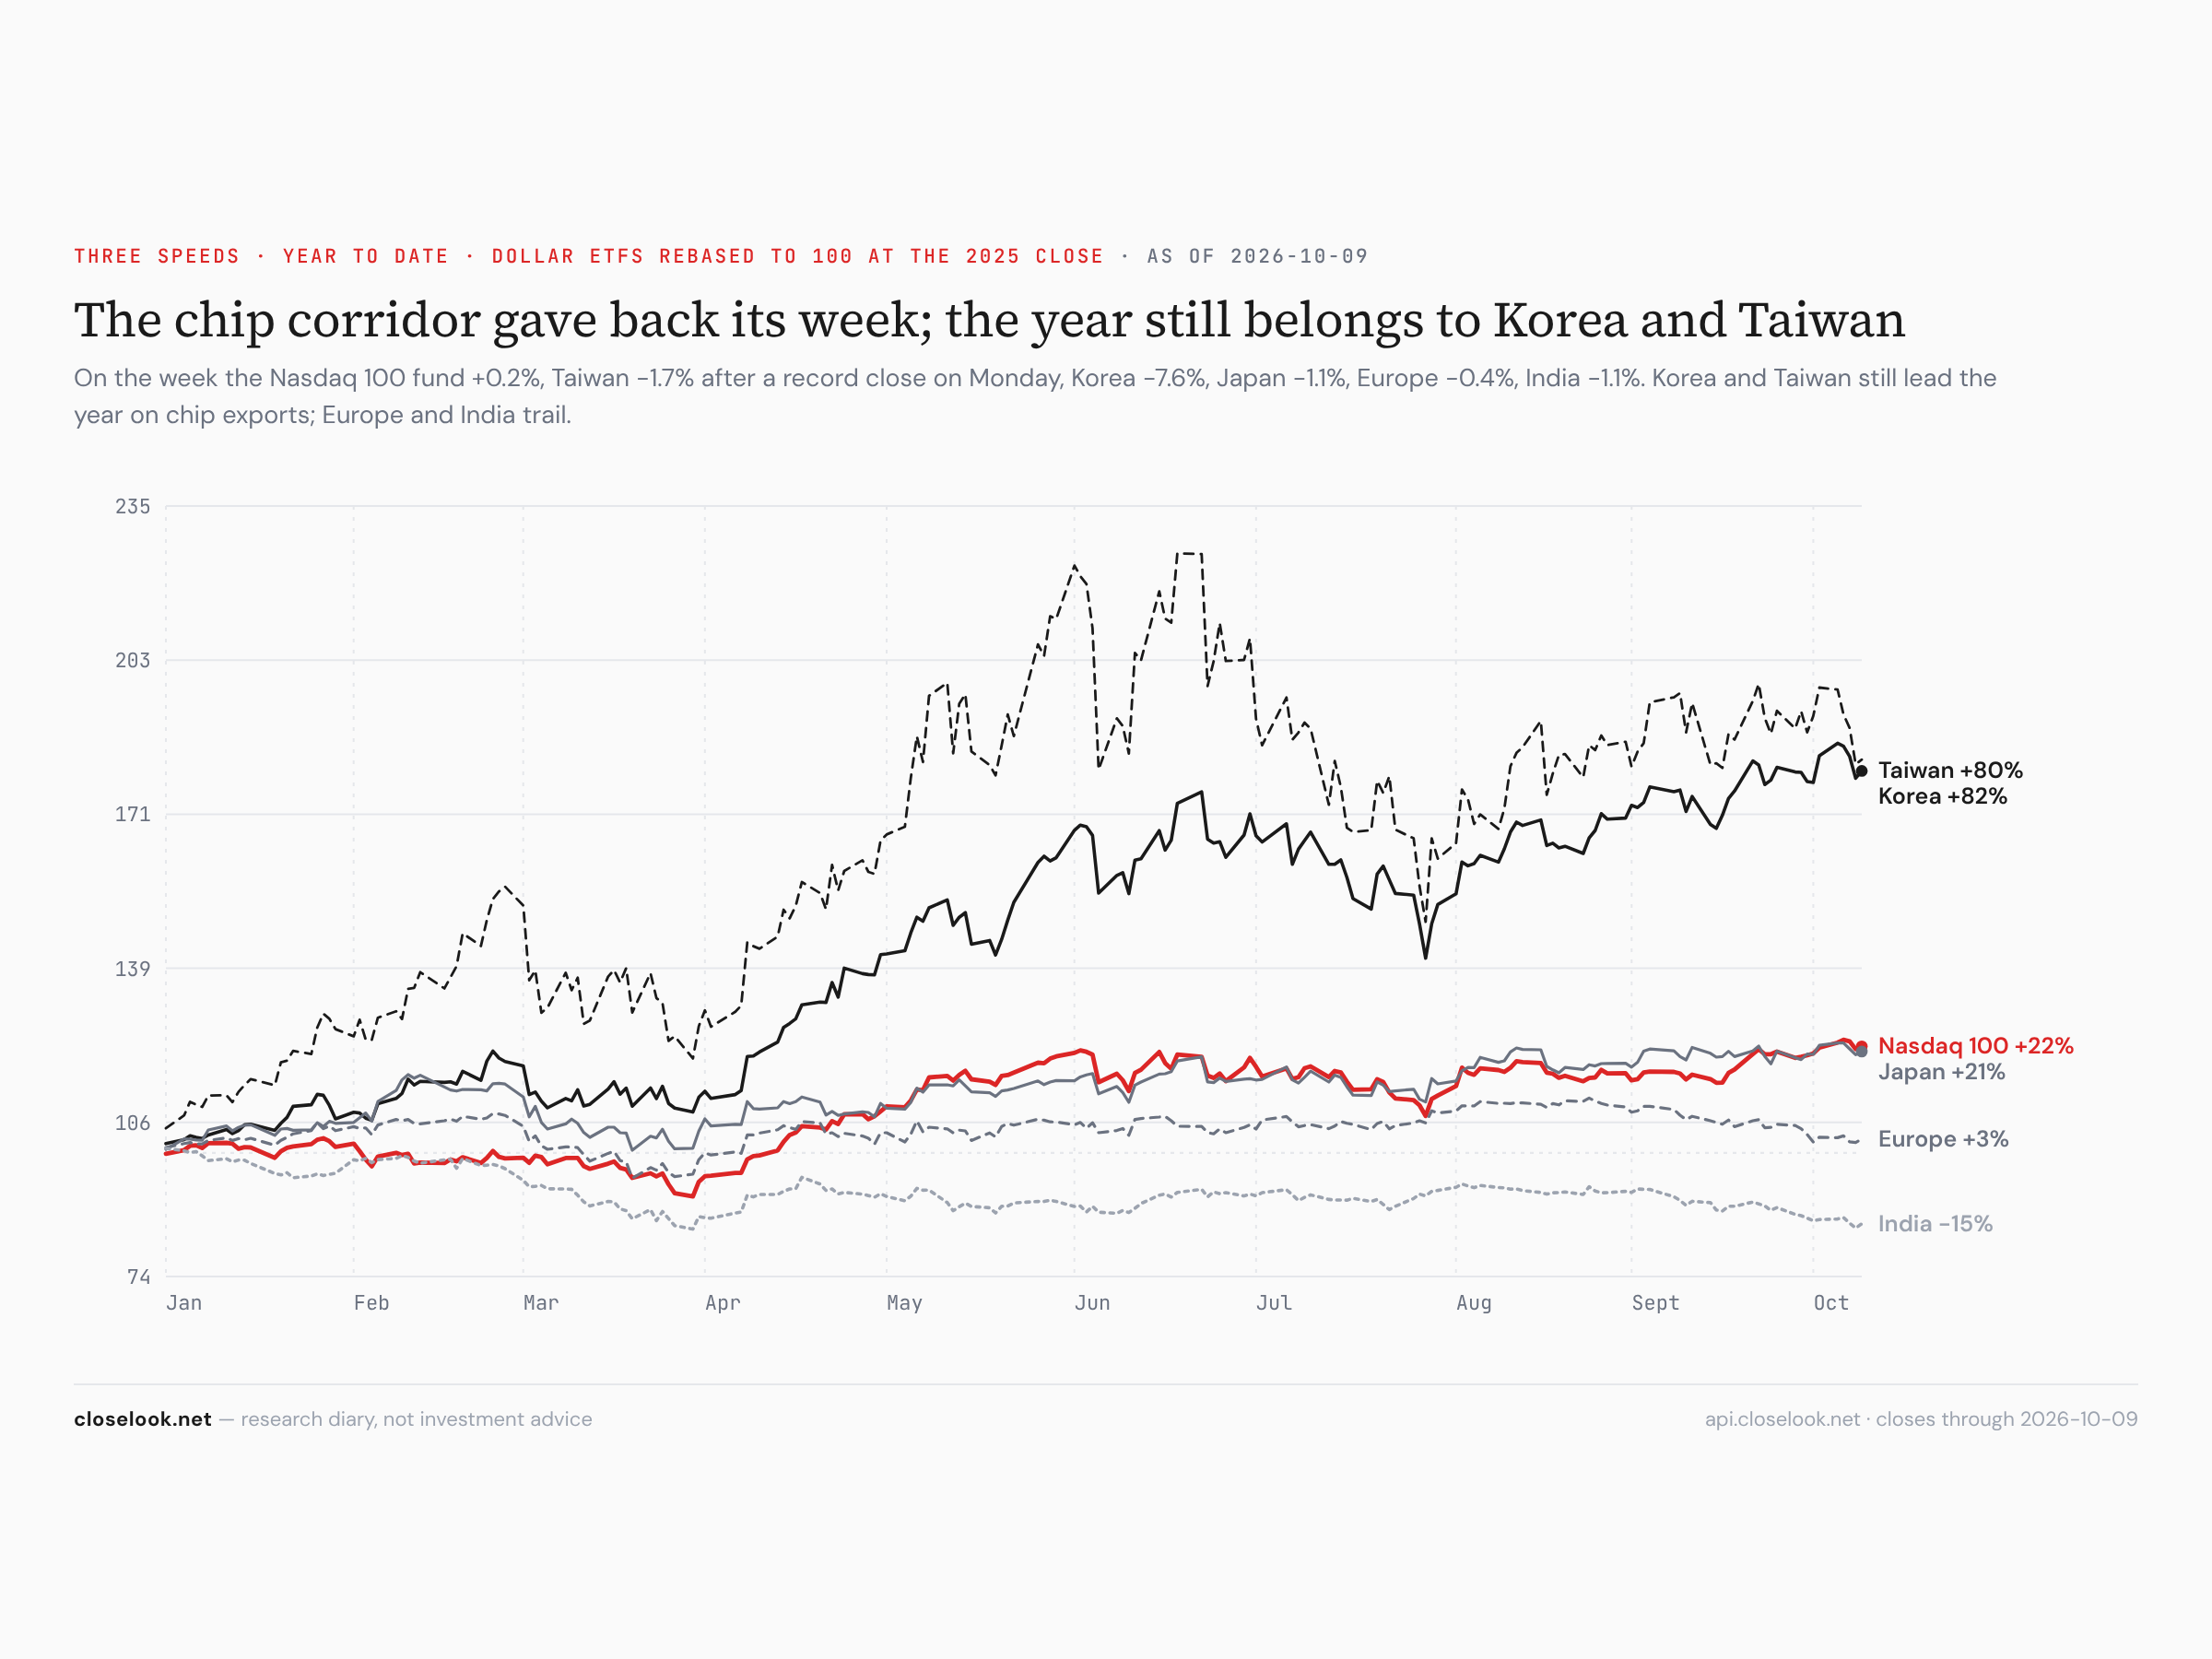
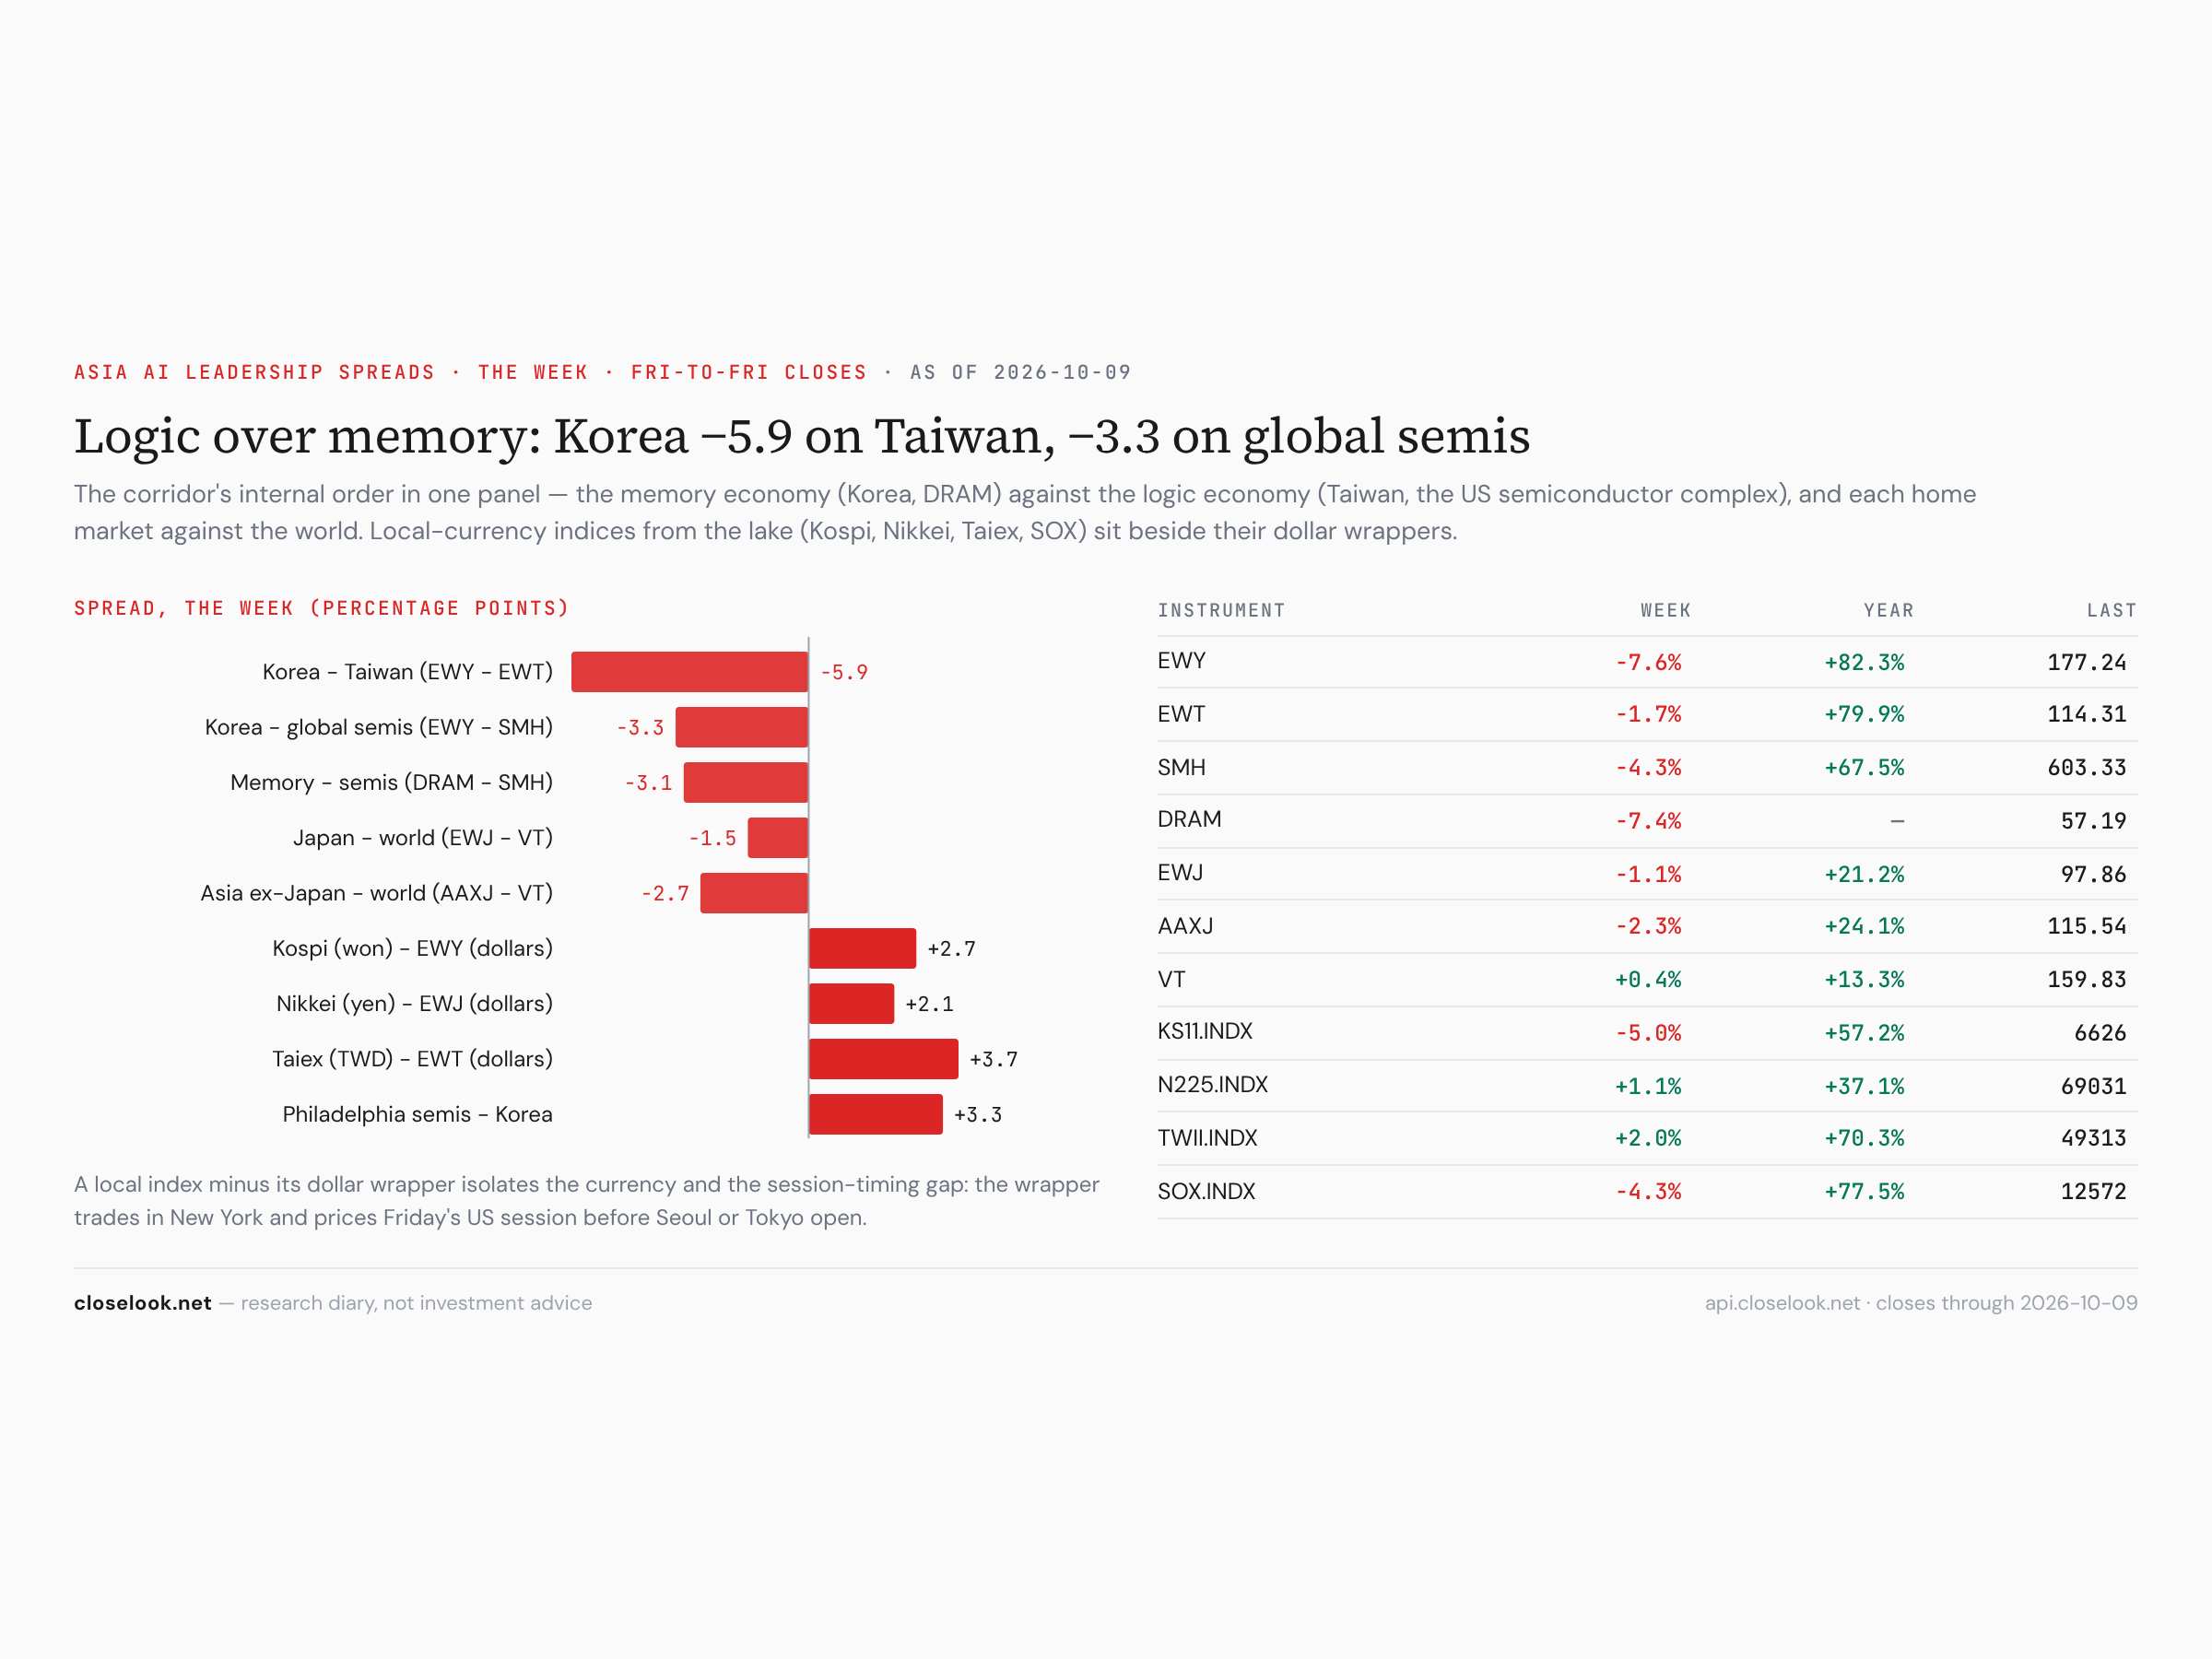
The chip corridor gave back its week. The other side of the board is the corridor that carried the quarter. Korea's fund fell 7.6% to 177.24; the Kospi lost 5.4% in its three sessions from Tuesday to Thursday — Seoul was shut on Monday and for Friday's Hangul Day holiday. Seoul sold its memory makers on Tuesday and Wednesday, and on Thursday the chip trade broke everywhere: a report put OpenAI's annual revenue nearer 50 billion dollars than 70 billion, and America's chip index fell 3.4% in a day. Taiwan's fund fell 1.7% to 114.31 — after a record close of 118.00 on Monday and a record Taiex of 49,823 on Tuesday — and Japan's fund 1.1%. Taipei was shut on Friday, so its week ends on Thursday's drop.
Inside technology — software up, chips down. The word "tech" hid two opposite weeks. Software rose: the cybersecurity fund CIBR +5.1%, the cloud fund CLOU +4.5%, software IGV +3.9% to 112.67, its highest close of 2026, internet FDN +3.3%. Chips fell: the semiconductor index −4.3%, the chip majors fund SMH −4.3%, equal-weight semis XSD −4.9%, the memory vehicle DRAM −7.4%. The money left the companies that build AI and went to the companies that run it and sell it. Global tech, which is mostly chips and the platforms, fell 1.4%. Friday's Pulse put it in four words — capex sold, apps bought — and this week the map followed: the countries that build lost, the countries that do not build gained.
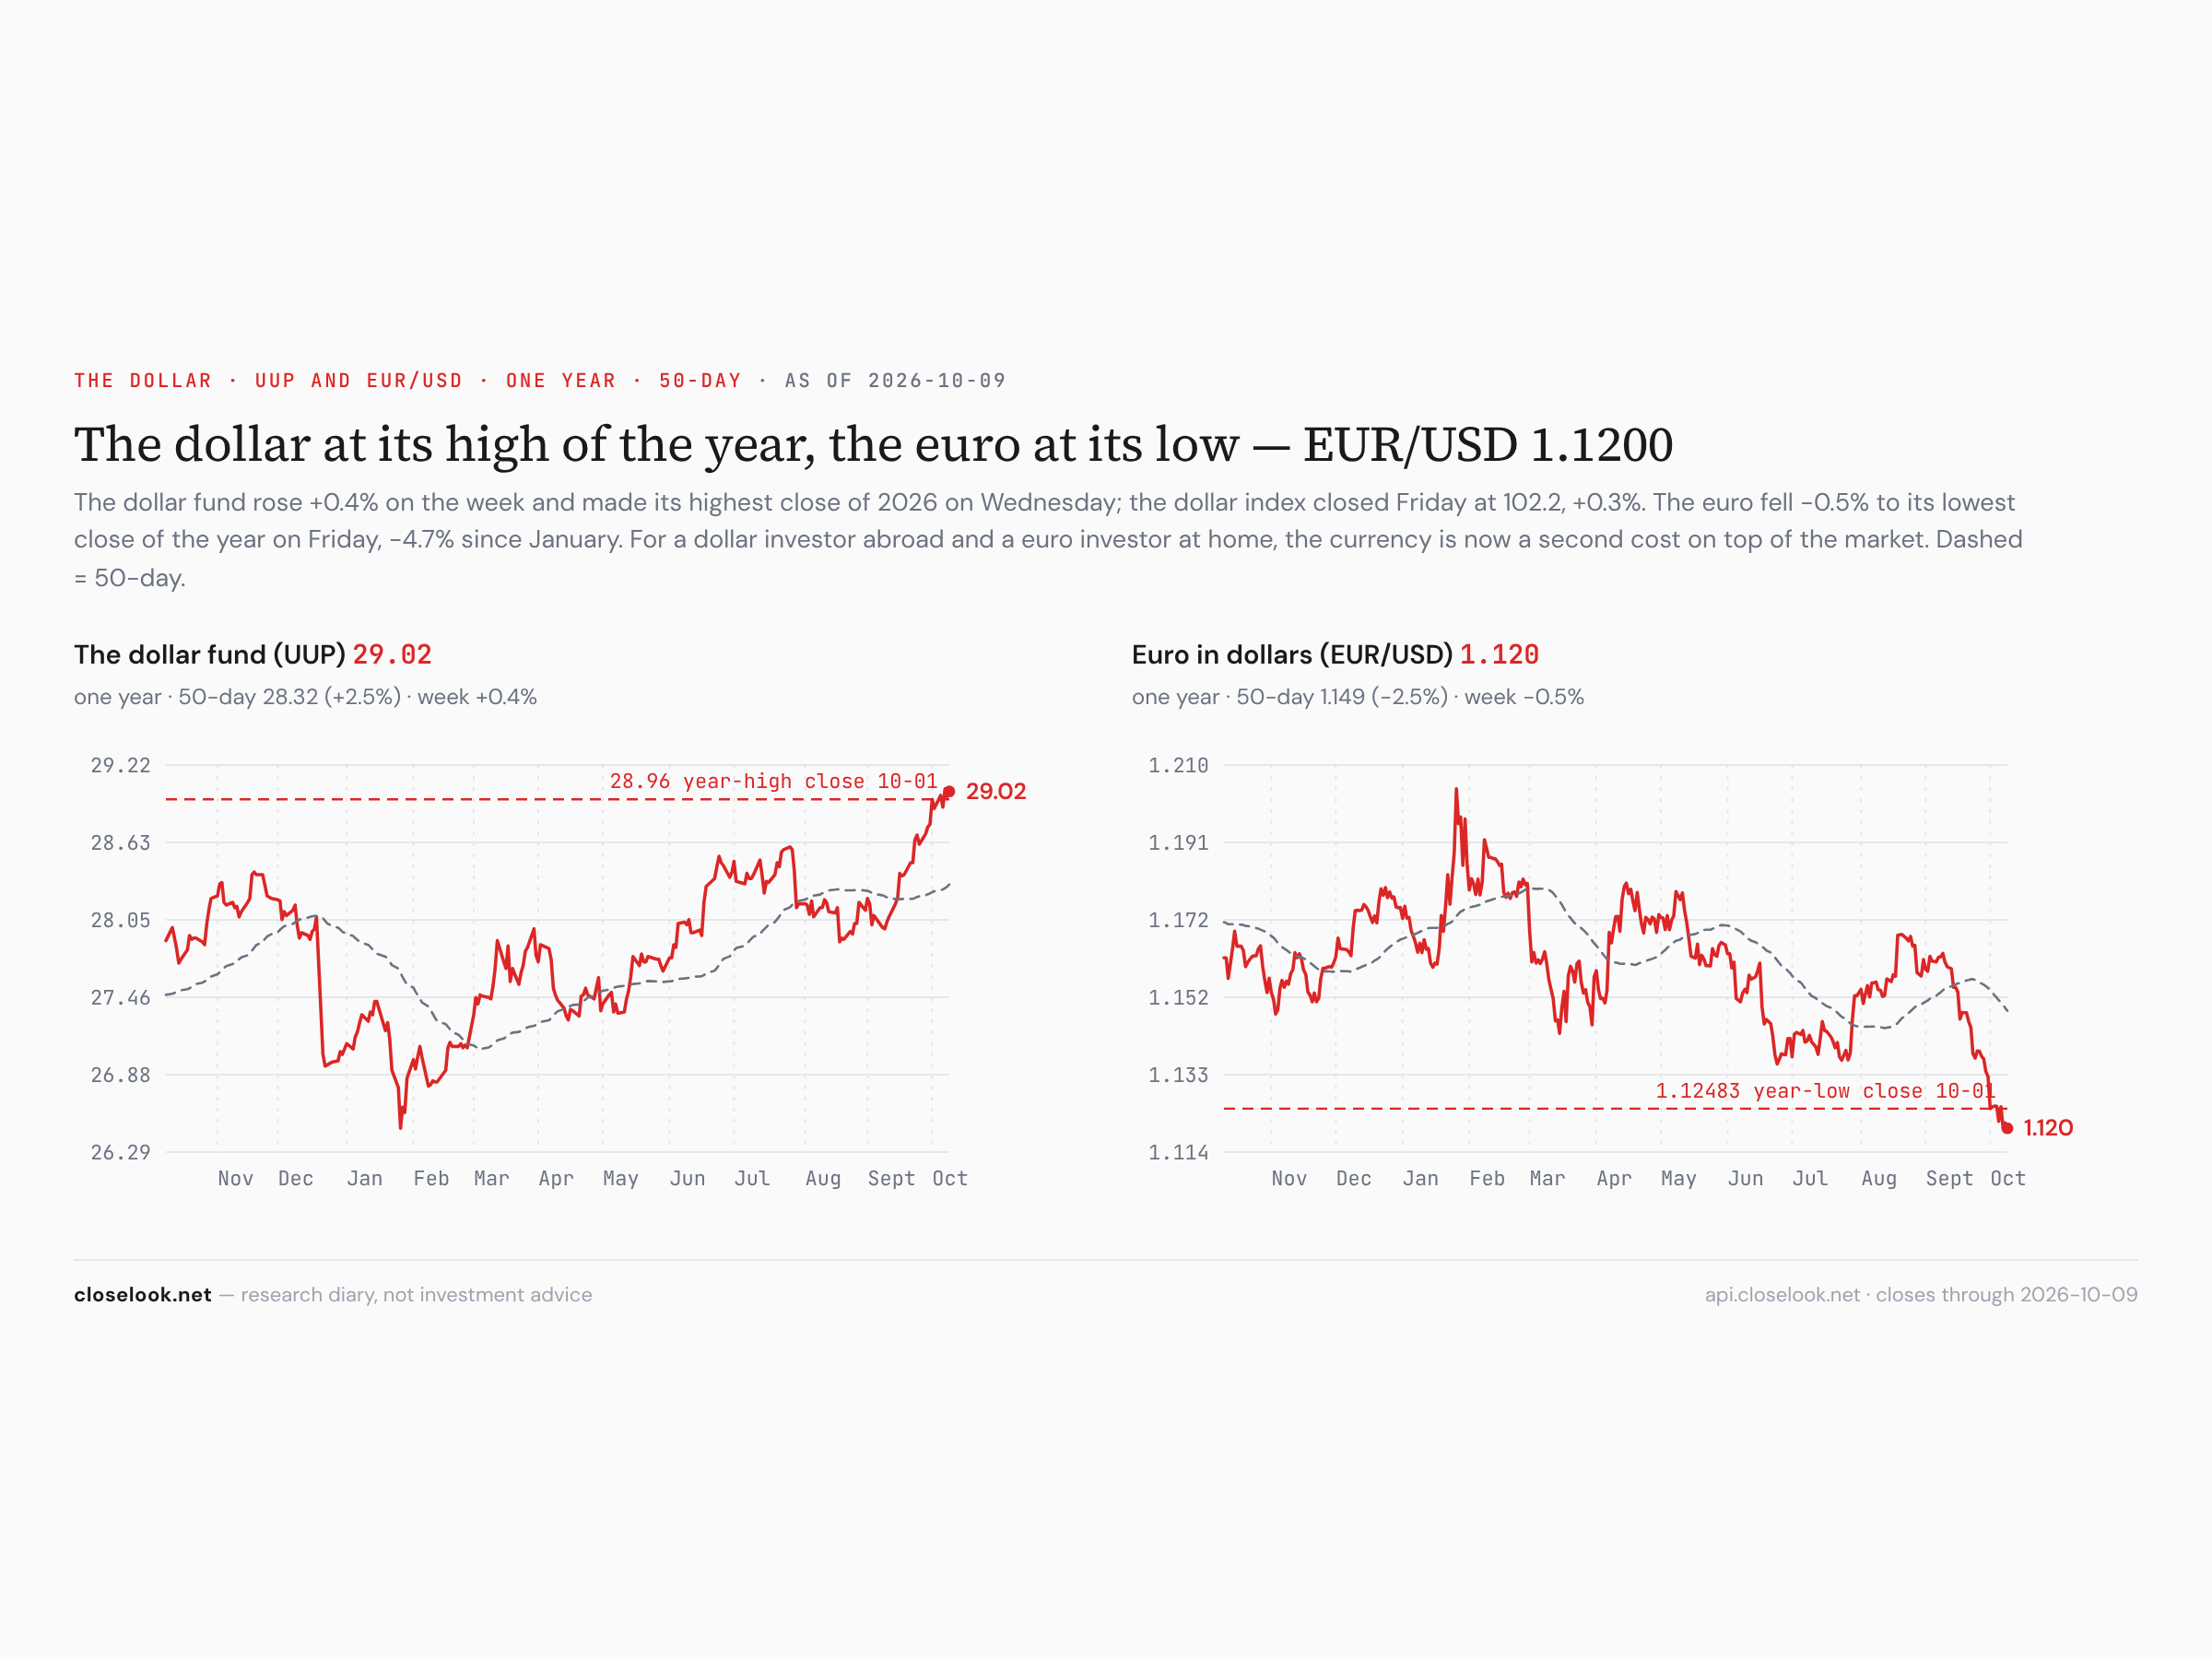
The dollar — another high, and the euro at its low. The dollar fund made a new high close of the year on Wednesday at 29.04 and ended at 29.02, +0.45%; the dollar index closed at 102.23. EUR/USD fell 0.47% to 1.1200 — the euro's lowest close of 2026, under last week's 1.1248, and down 4.4% since January. The yen closed at 158.26. A dollar investor in Europe lost on the currency again; a euro investor at home holds a currency that buys a little less of everything priced in dollars every week.
The regional board — fourteen green of thirty-five. The top: Brazil +14.01%, Argentina +4.78%, China large caps +3.16%, Hong Kong +2.27%, Poland +1.84%, Indonesia +1.80%, Mexico +1.21%. The bottom: Korea −7.63%, Southeast Asia −3.34%, Austria −3.11%, the Netherlands −1.83%, Taiwan −1.74%, France −1.68%, the Euro Stoxx 50 −1.61%. Last week five were green; this week fourteen. The best-to-worst spread was 21.6 points, from 8.9 a week ago — one market up fourteen, one down eight. A board that turns greener while its leaders fall is money rotating, not money leaving.
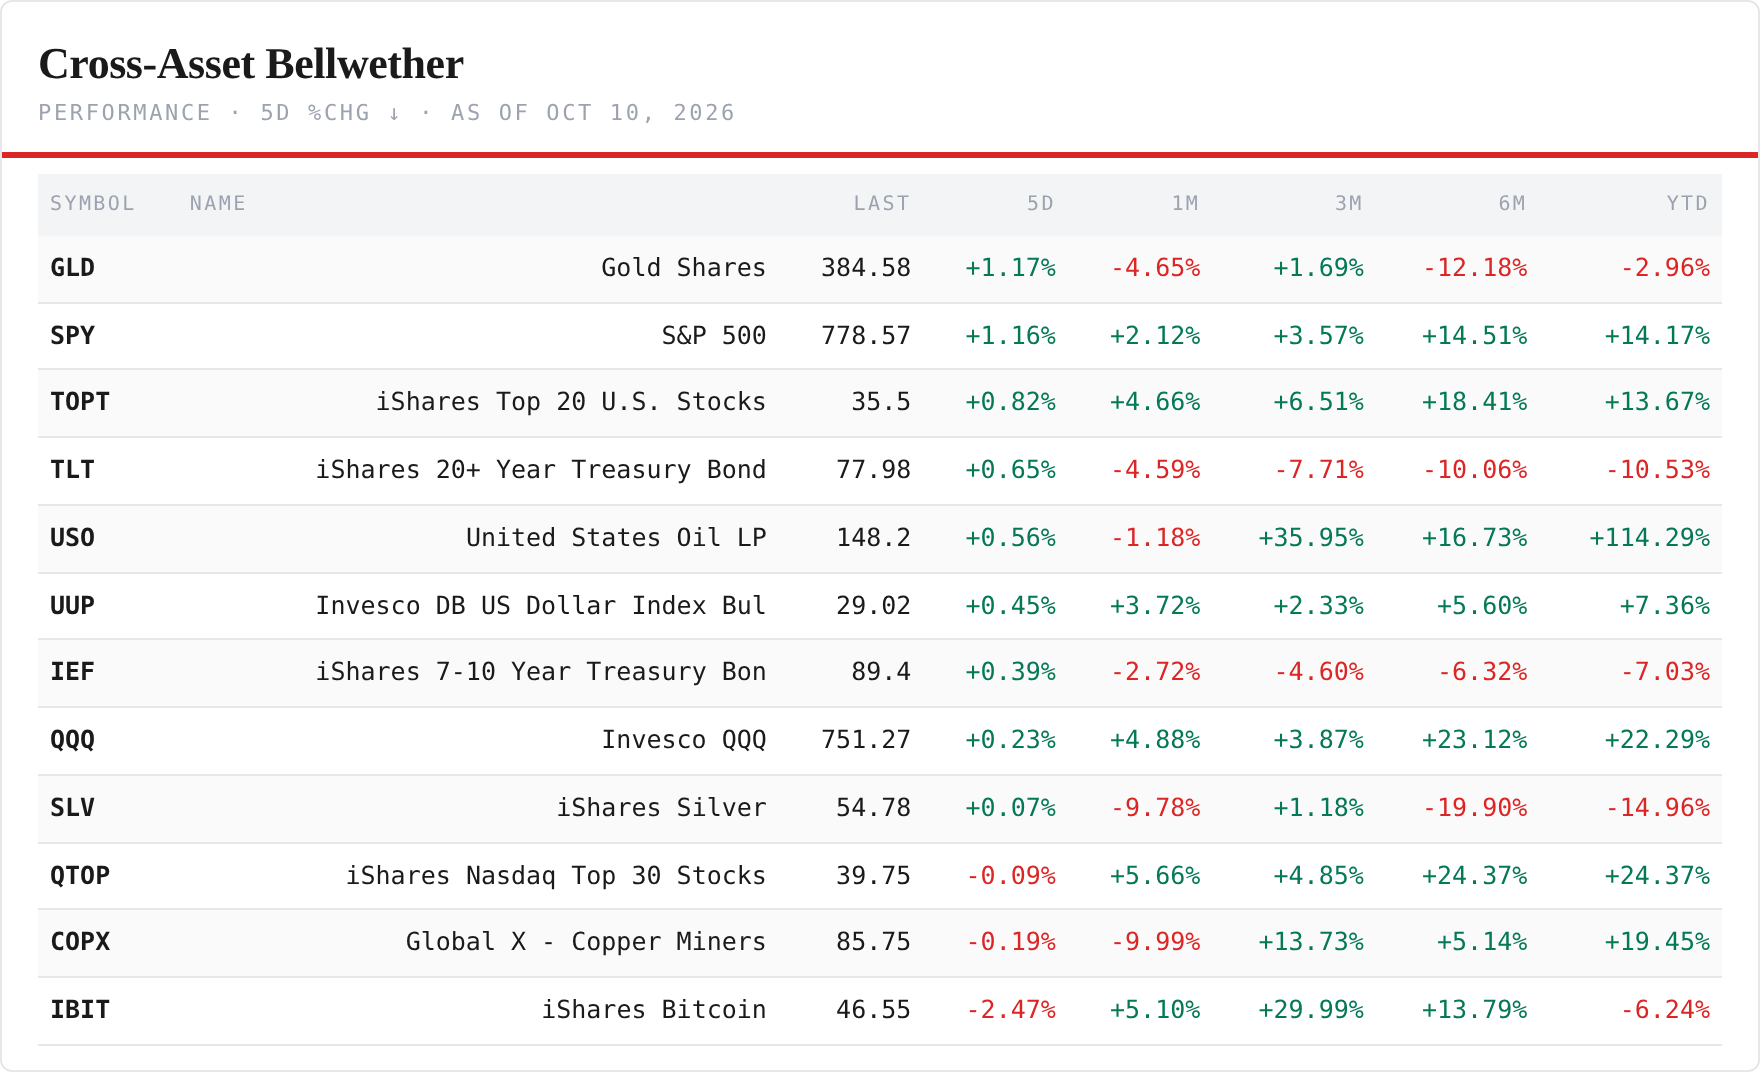
The cross-asset backdrop — gold up, the coin down. Nine green of twelve: gold +1.17%, the S&P +1.16%, the US top-20 fund +0.82%, the long bond +0.65%, oil +0.56%, the dollar +0.45%, the belly +0.39%, the Nasdaq 100 +0.23%, silver +0.07%. The red three: the bitcoin fund −2.47%, copper miners −0.19%, the Nasdaq top-30 fund −0.09%. Brent rose above 103 dollars a barrel on Thursday. The bond funds rose a little after Monday's new low; the coin lost its floor.
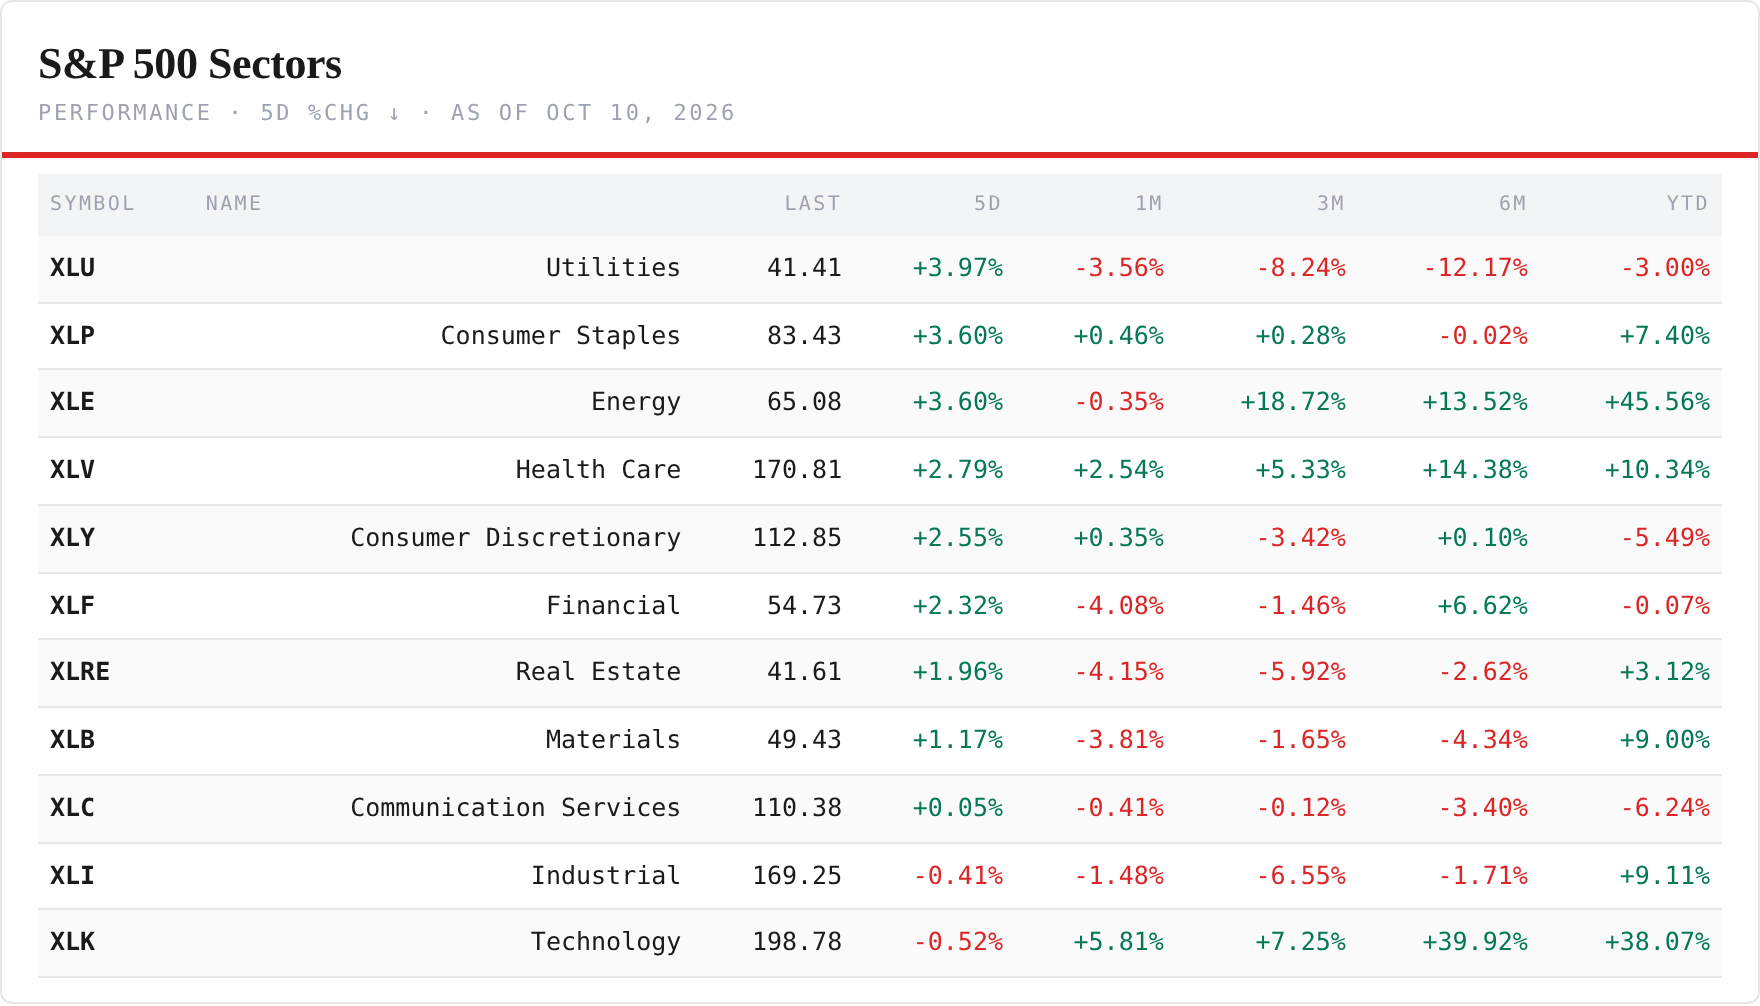
The US sectors — ten of eleven green. Utilities +4.0%, staples +3.6%, energy +3.6%, health care +2.8%, consumer discretionary +2.6%, financials +2.3%, real estate +2.0%. The two red: technology −0.5% and industrials −0.4%. The equal-weight S&P rose 1.58%, the S&P 1.16%, the Nasdaq 100 0.23%; small caps fell 0.92%. Last week one sector carried the index. This week every sector but the one that led the year rose — and the average stock beat the index.
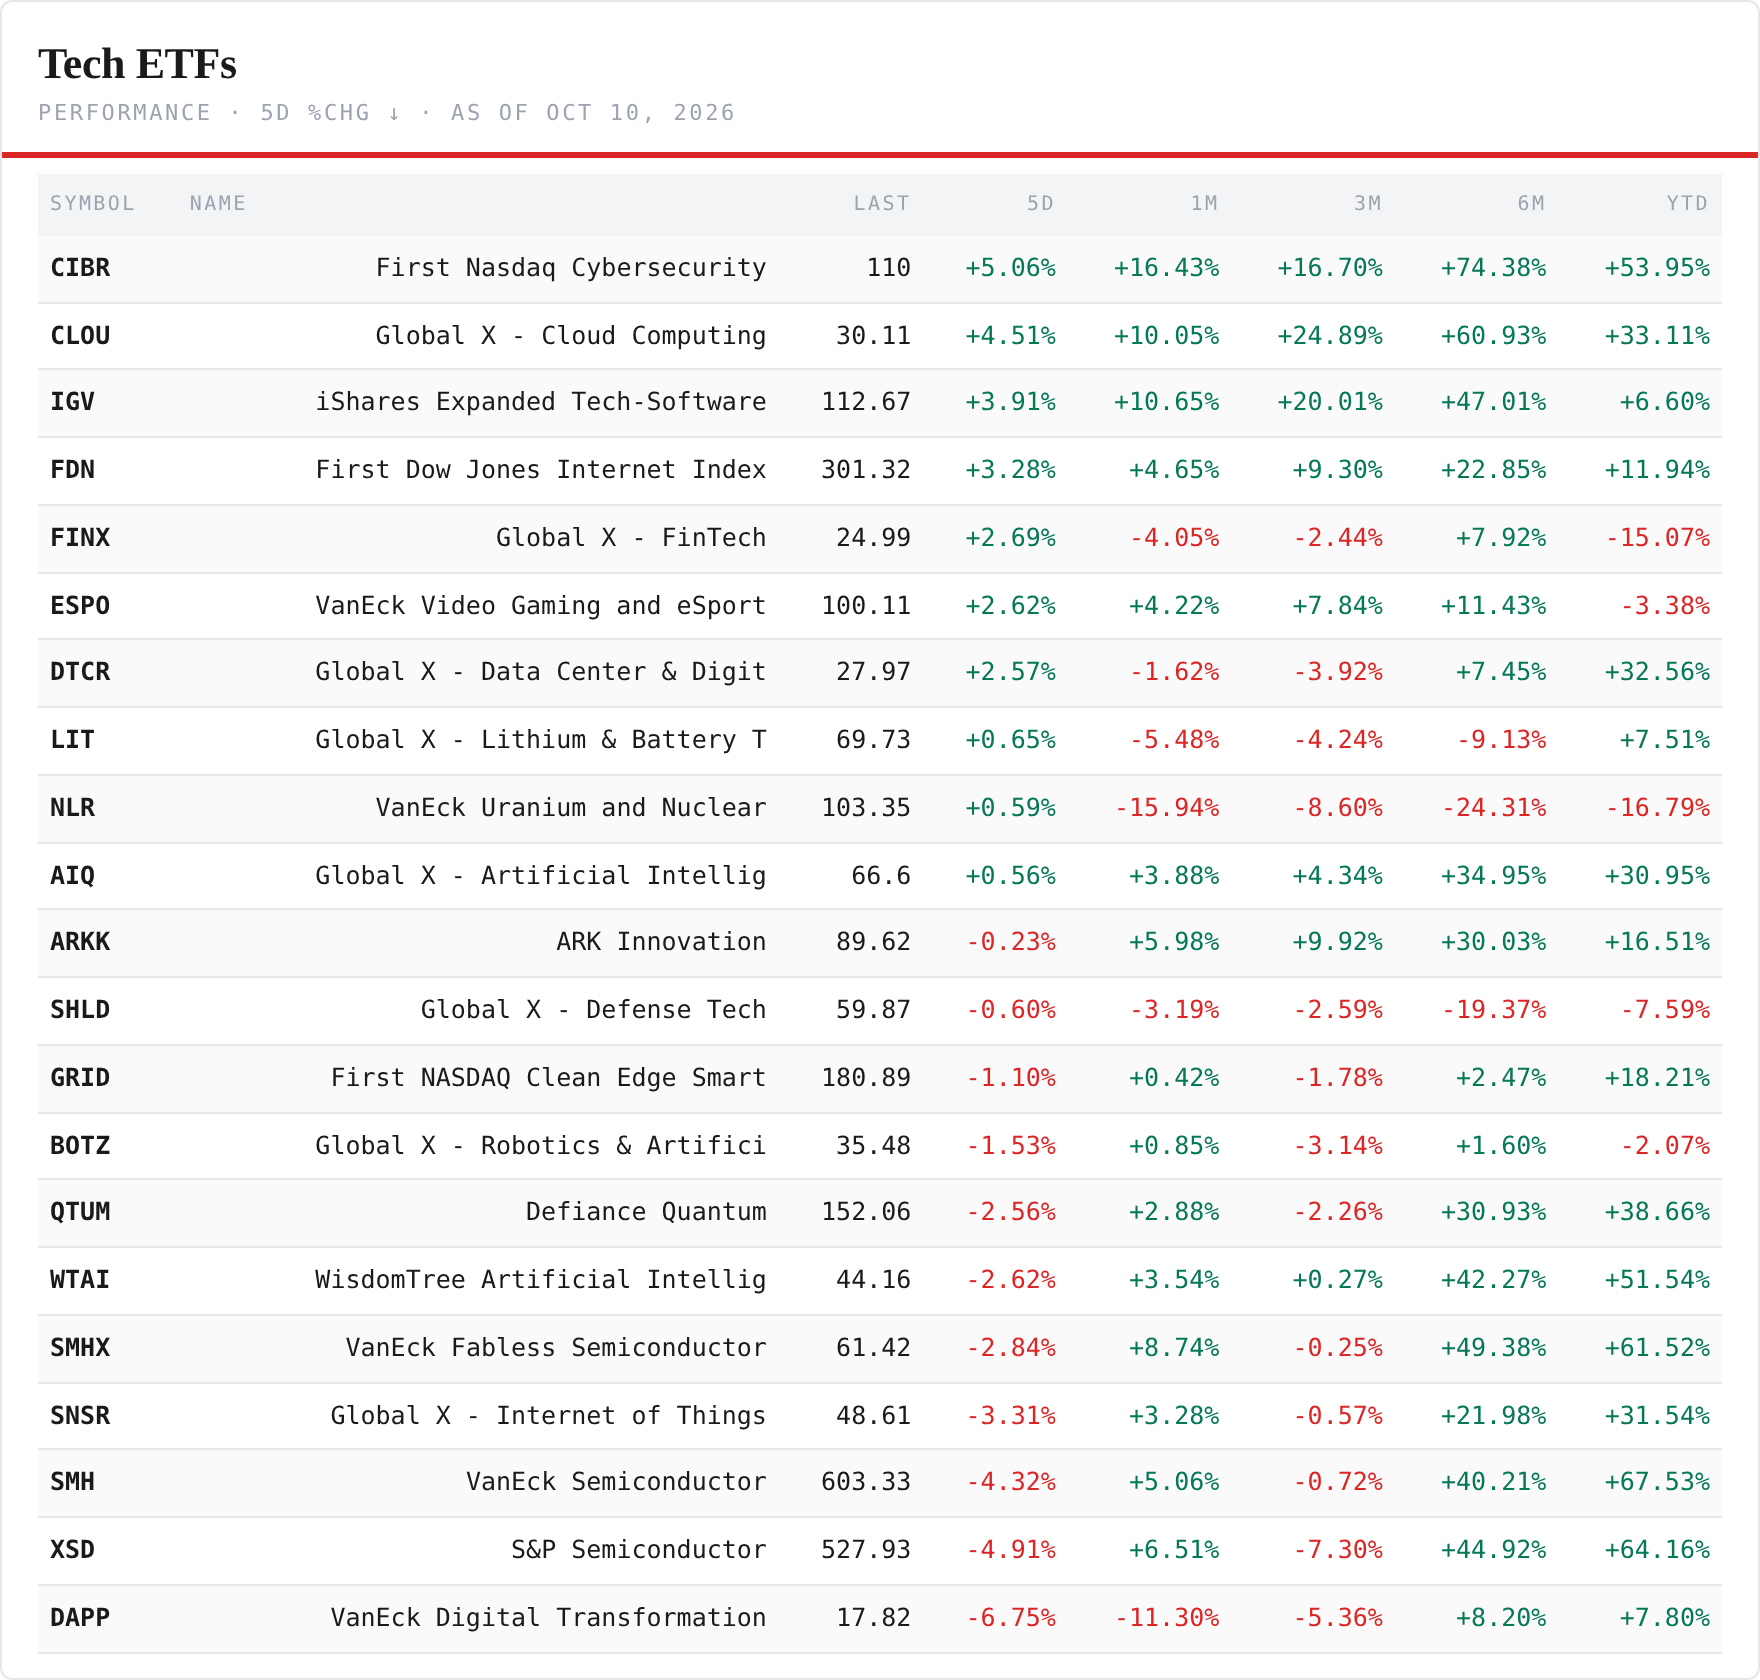
The tech ETFs — ten of twenty-one green, split down the middle. The green half is software and the internet: CIBR +5.06%, CLOU +4.51%, IGV +3.91%, FDN +3.28%, fintech +2.69%, gaming +2.62%, data centers +2.57%. The red half is silicon: digital transformation −6.75%, XSD −4.91%, SMH −4.32%, the Internet of Things −3.31%, the fabless fund −2.84%, the WisdomTree AI fund −2.62%, quantum −2.56%. Last week software rose with the chips. This week it rose against them.
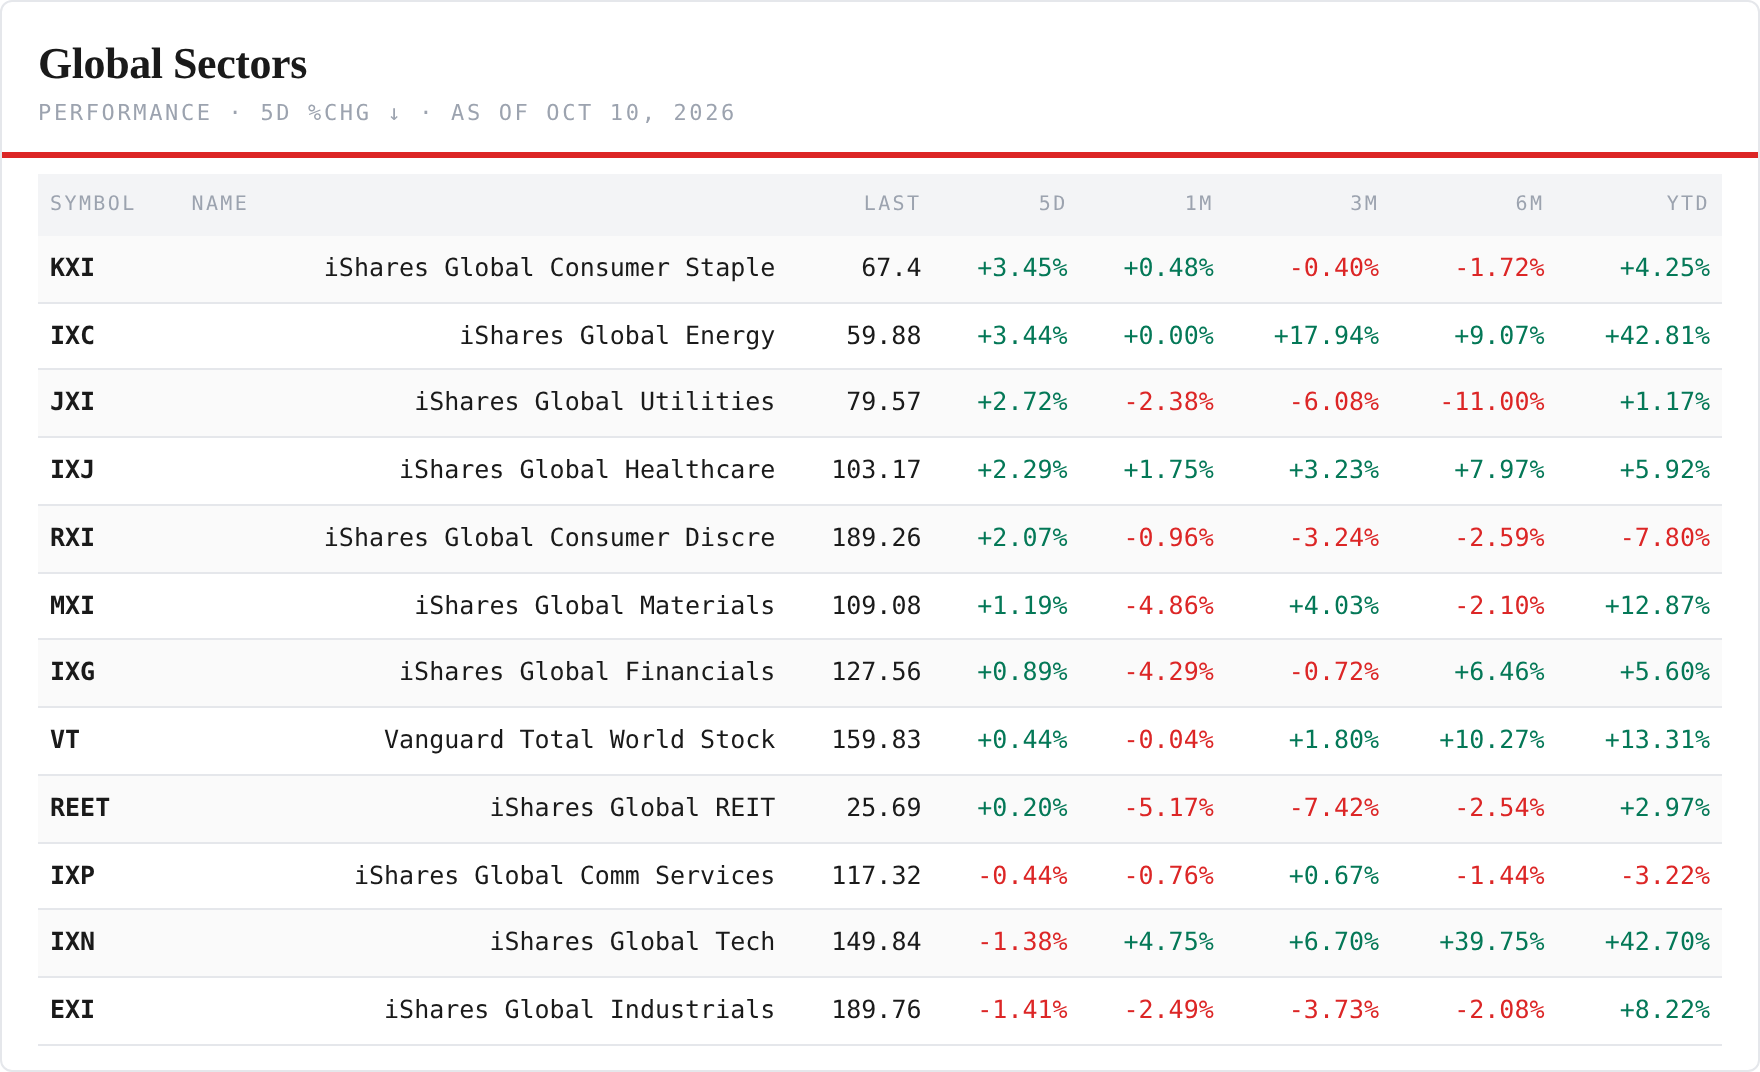
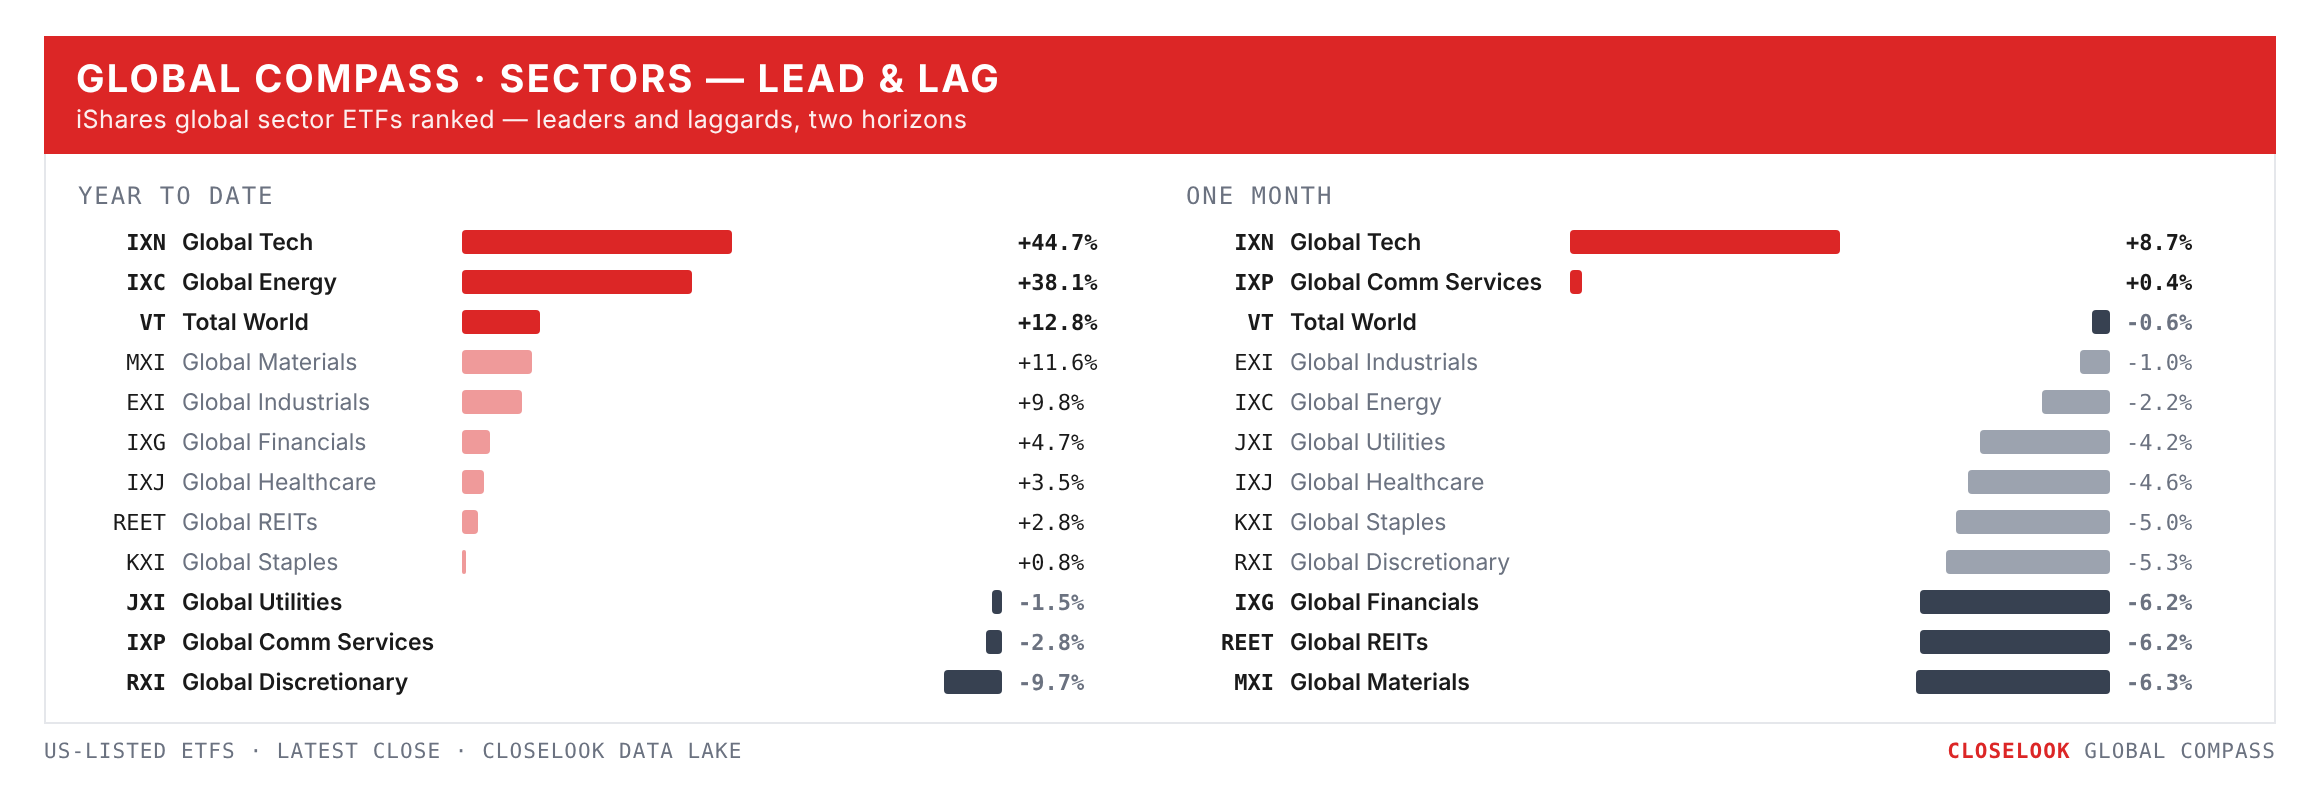
The global sectors — the defensives led. Nine of eleven green: staples +3.45%, energy +3.44%, utilities +2.72%, health care +2.29%, discretionary +2.07%, materials +1.19%, financials +0.89%. The red two: industrials −1.41% and technology −1.38%. Global tech closed at 149.84 — ten cents above the 149.74 June high this letter named as the line from above. Financials spent a fifth week under the 134.55 August line, materials a seventh under the February line.
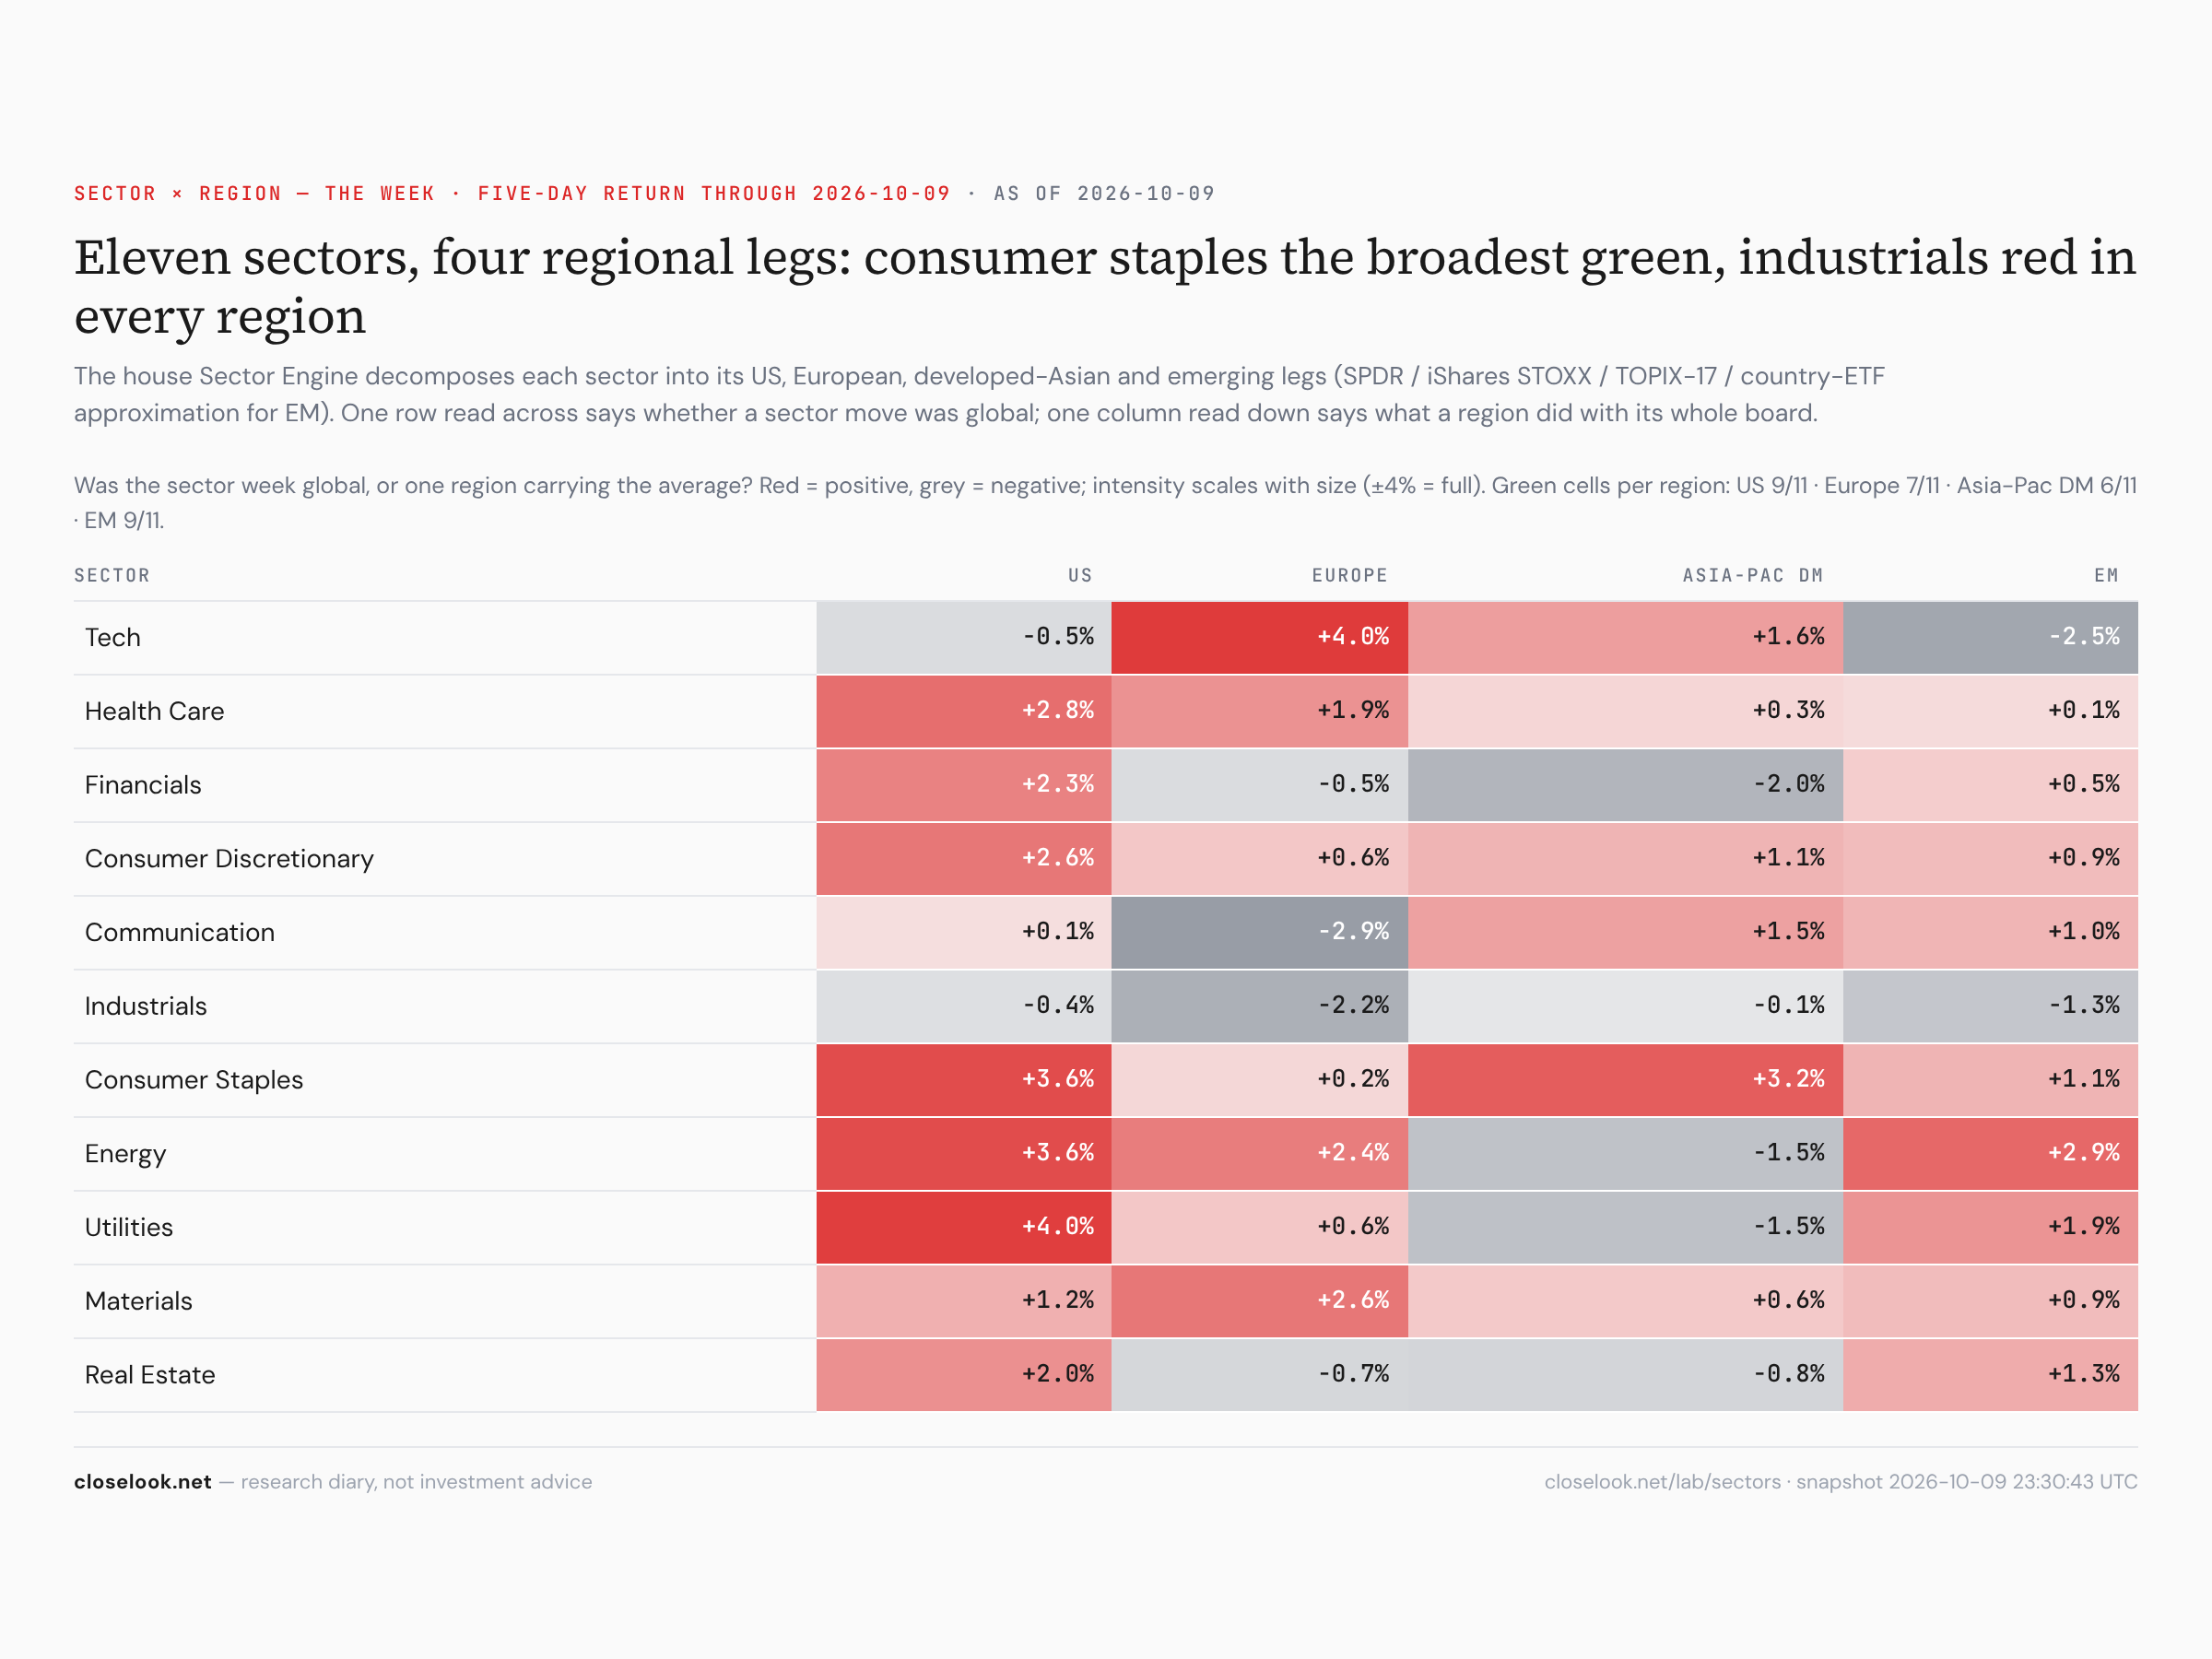
Was the sector week global, or one region carrying it? The house Sector Engine splits each sector into four regional legs. Technology rose in Europe (+4.0%) and developed Asia (+1.6%) and fell in America (−0.5%) and emerging markets (−2.5%) — Europe's tech leg is heavy in software, emerging markets' in Korean and Taiwanese chips. Staples rose in all four regions, health care in all four. The US-minus-Europe spread was positive in nine sectors of eleven, staples and utilities +3.4 points each — and technology −4.5, the one sector where Europe beat America this week.
The Global Compass
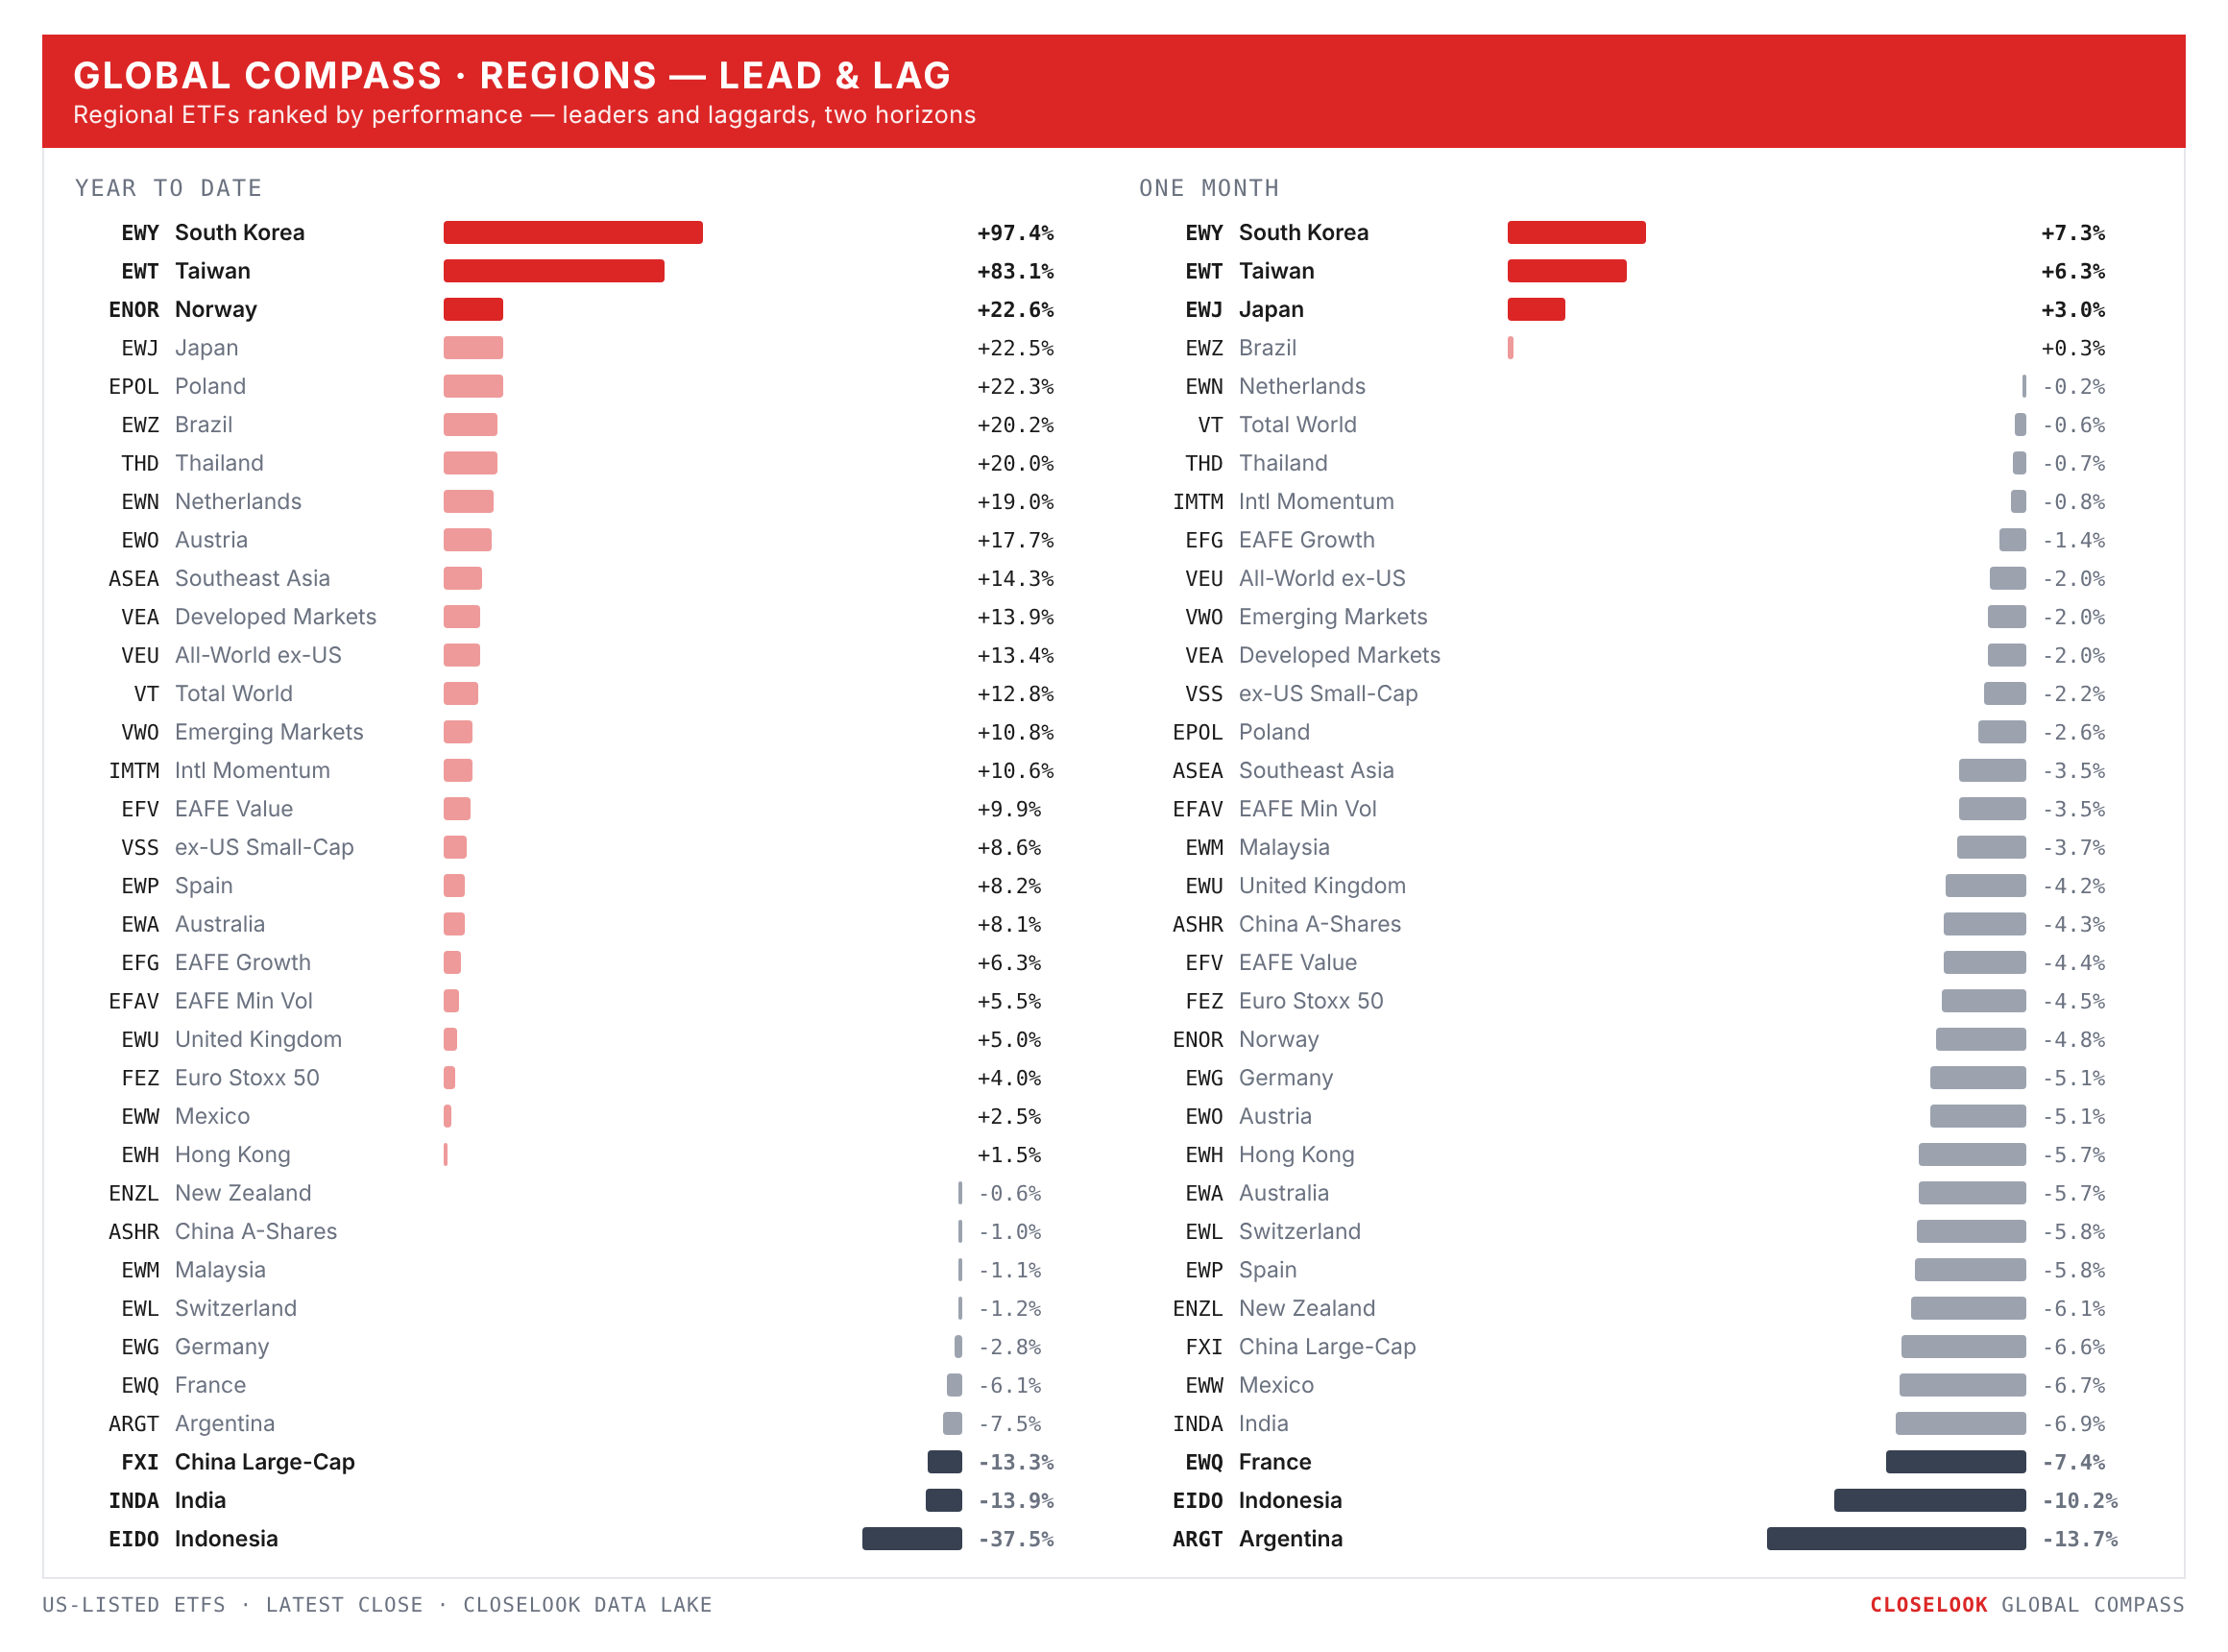
Regions: emerging over developed. VWO +0.34% against VEA −1.10% — a 1.4-point gap, with Latin America and China lifting the emerging basket while Korea and Taiwan pulled on it. China's large caps rose 3.2% as the mainland came back from Golden Week; its A-shares fell 0.4%.
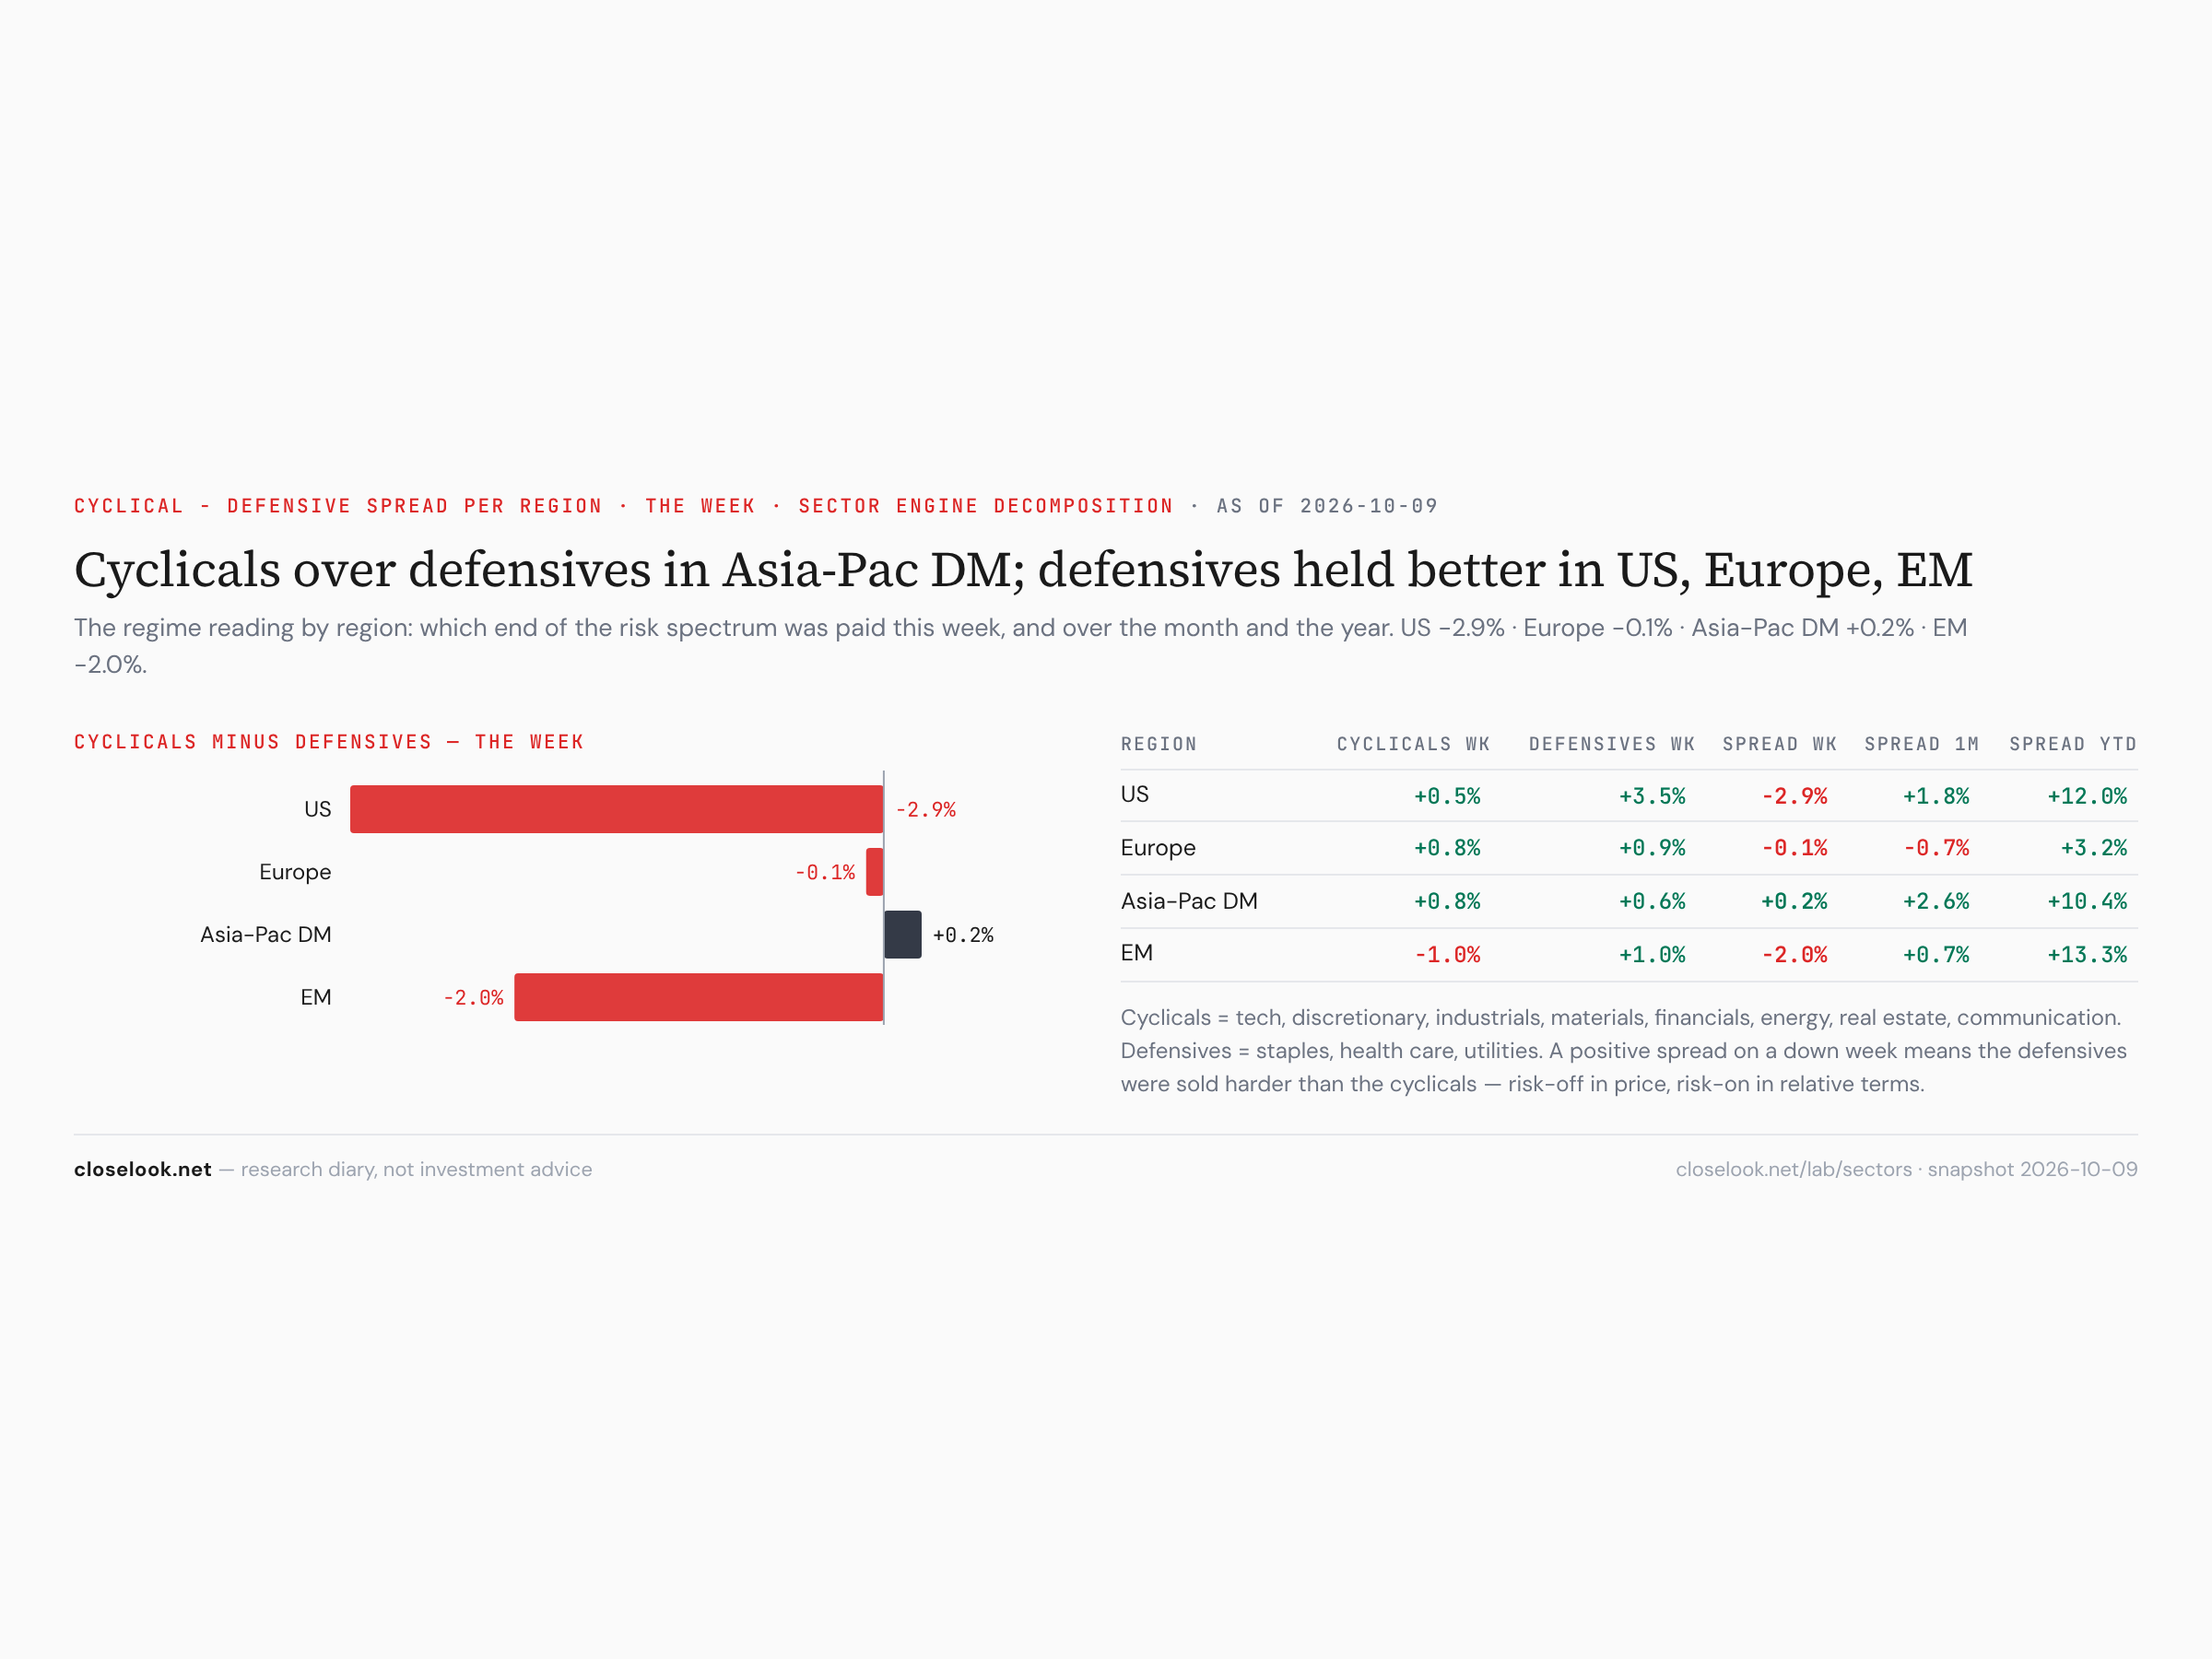
Sectors: defensives over cyclicals in America. The engine's cyclical-minus-defensive spread was −2.9 points in the US (cyclicals +0.5%, defensives +3.5%), −2.0 in emerging markets, −0.1 in Europe and +0.2 in developed Asia. On the year the US spread is still +12.0 points. One week of defensives does not undo a year of cyclicals; it does show where the money went when the chips fell.
Sectors: the leaders' bench. Technology 149.84, ten cents above its line after a record close of 152.94 on Tuesday. Industrials 189.76, 8.3% under August. Financials 127.56, 6.9% under the September 3 record, five weeks under its line. Materials 109.08, 7.9% under the August 25 record, seven weeks under the February line.
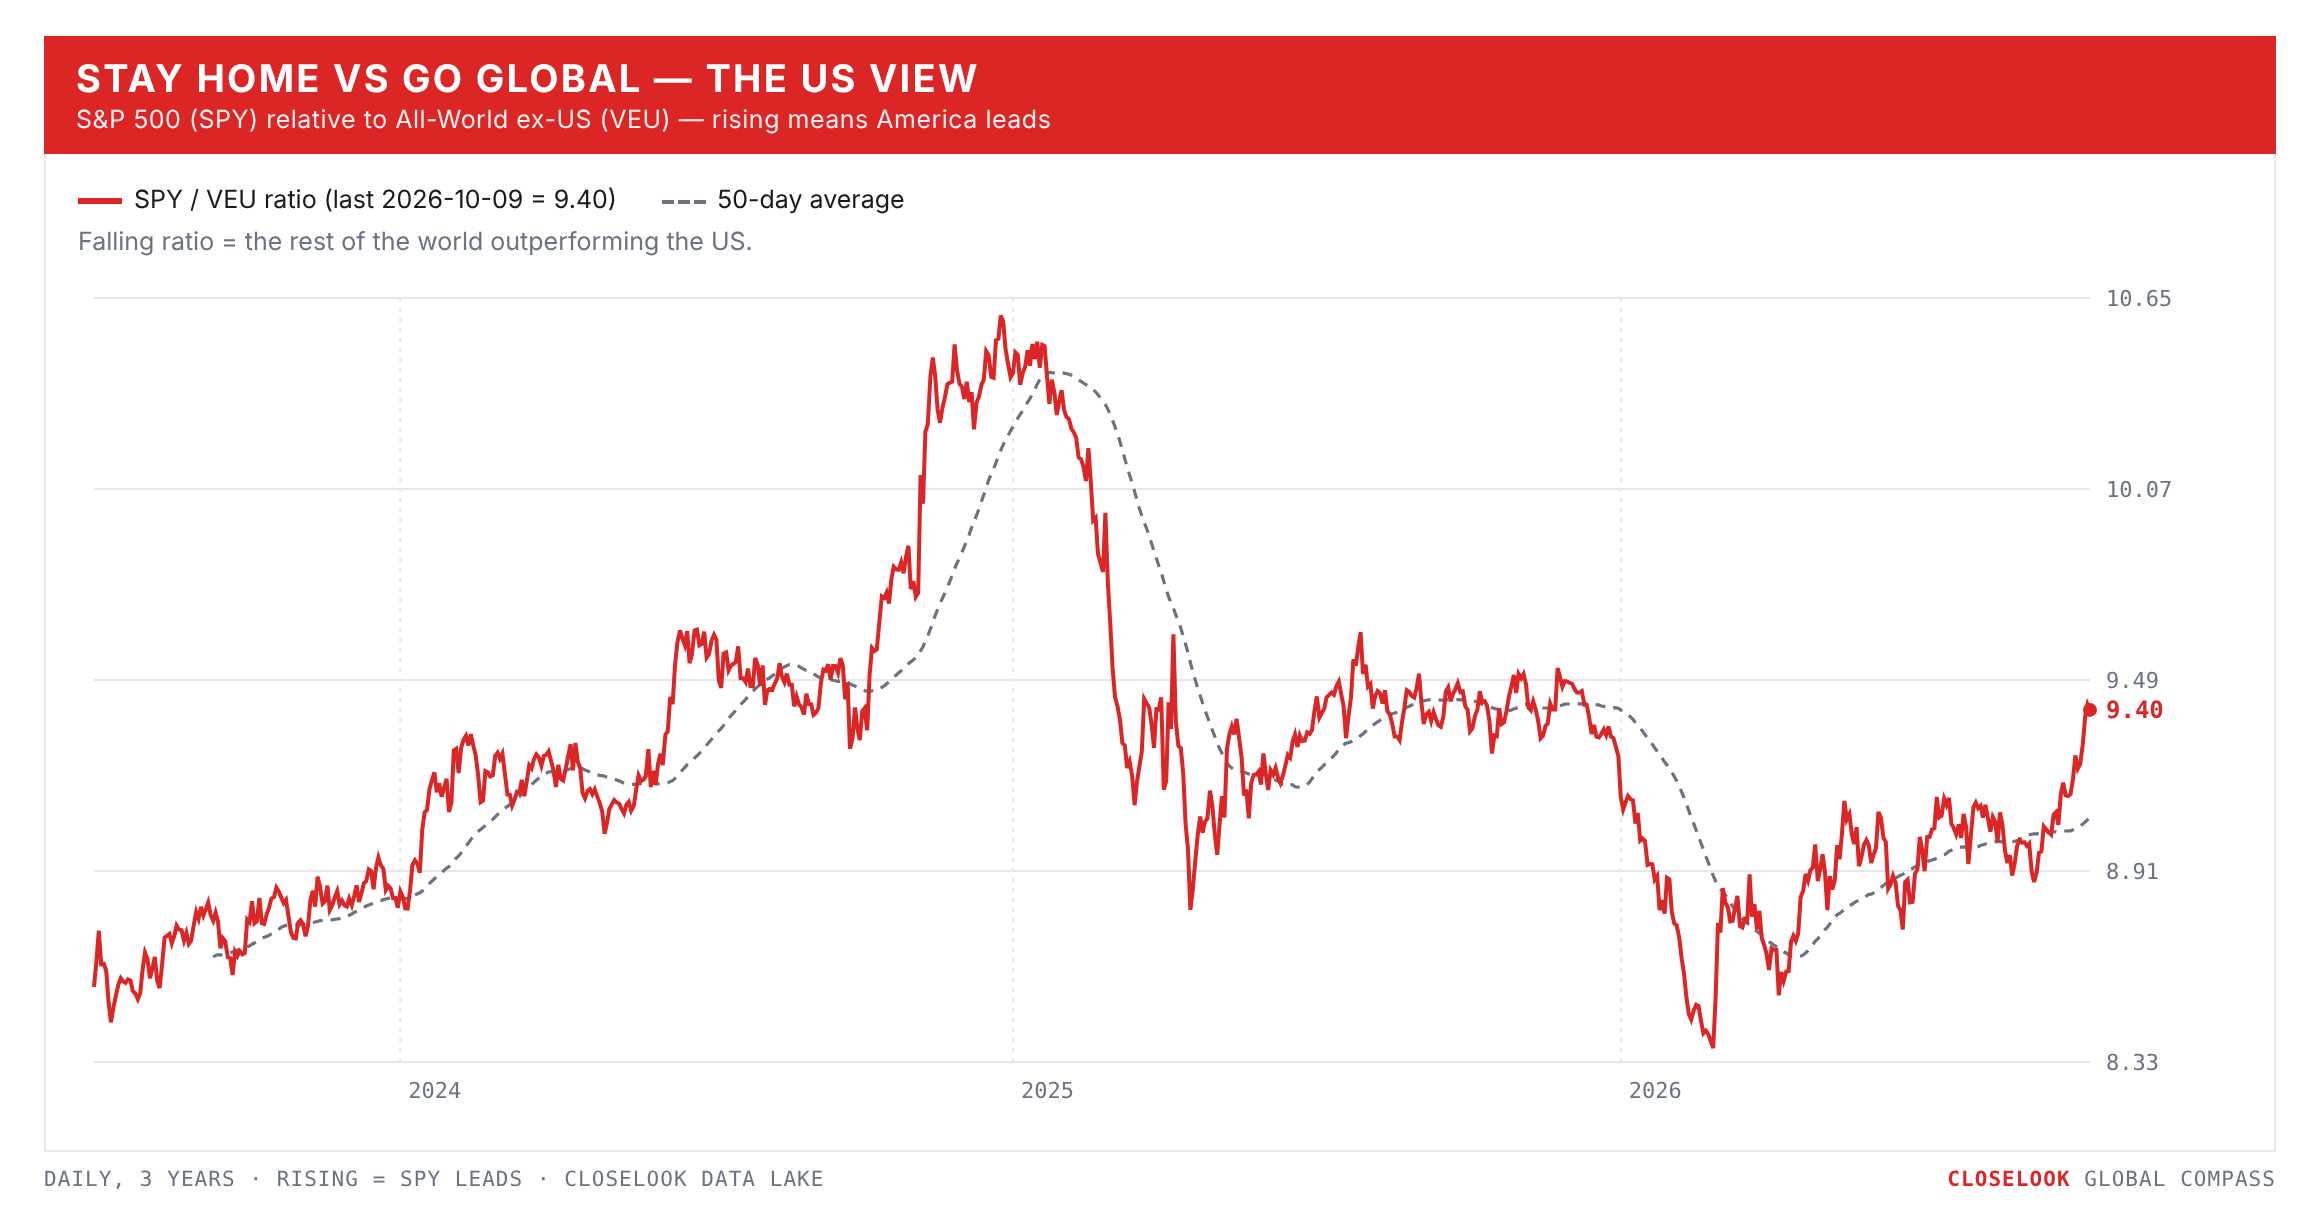
Stay home vs go global — the US view. America won a fifth week: SPY +1.16%, VT +0.44%, VEU −0.75%. And now the year: +14.2% against +13.3% against +12.6%. Five weeks ago the world ex-US led by 4.5 points; today it trails by 1.6. The SPY/VEU ratio on the chart below has turned up from its September low and kept going.
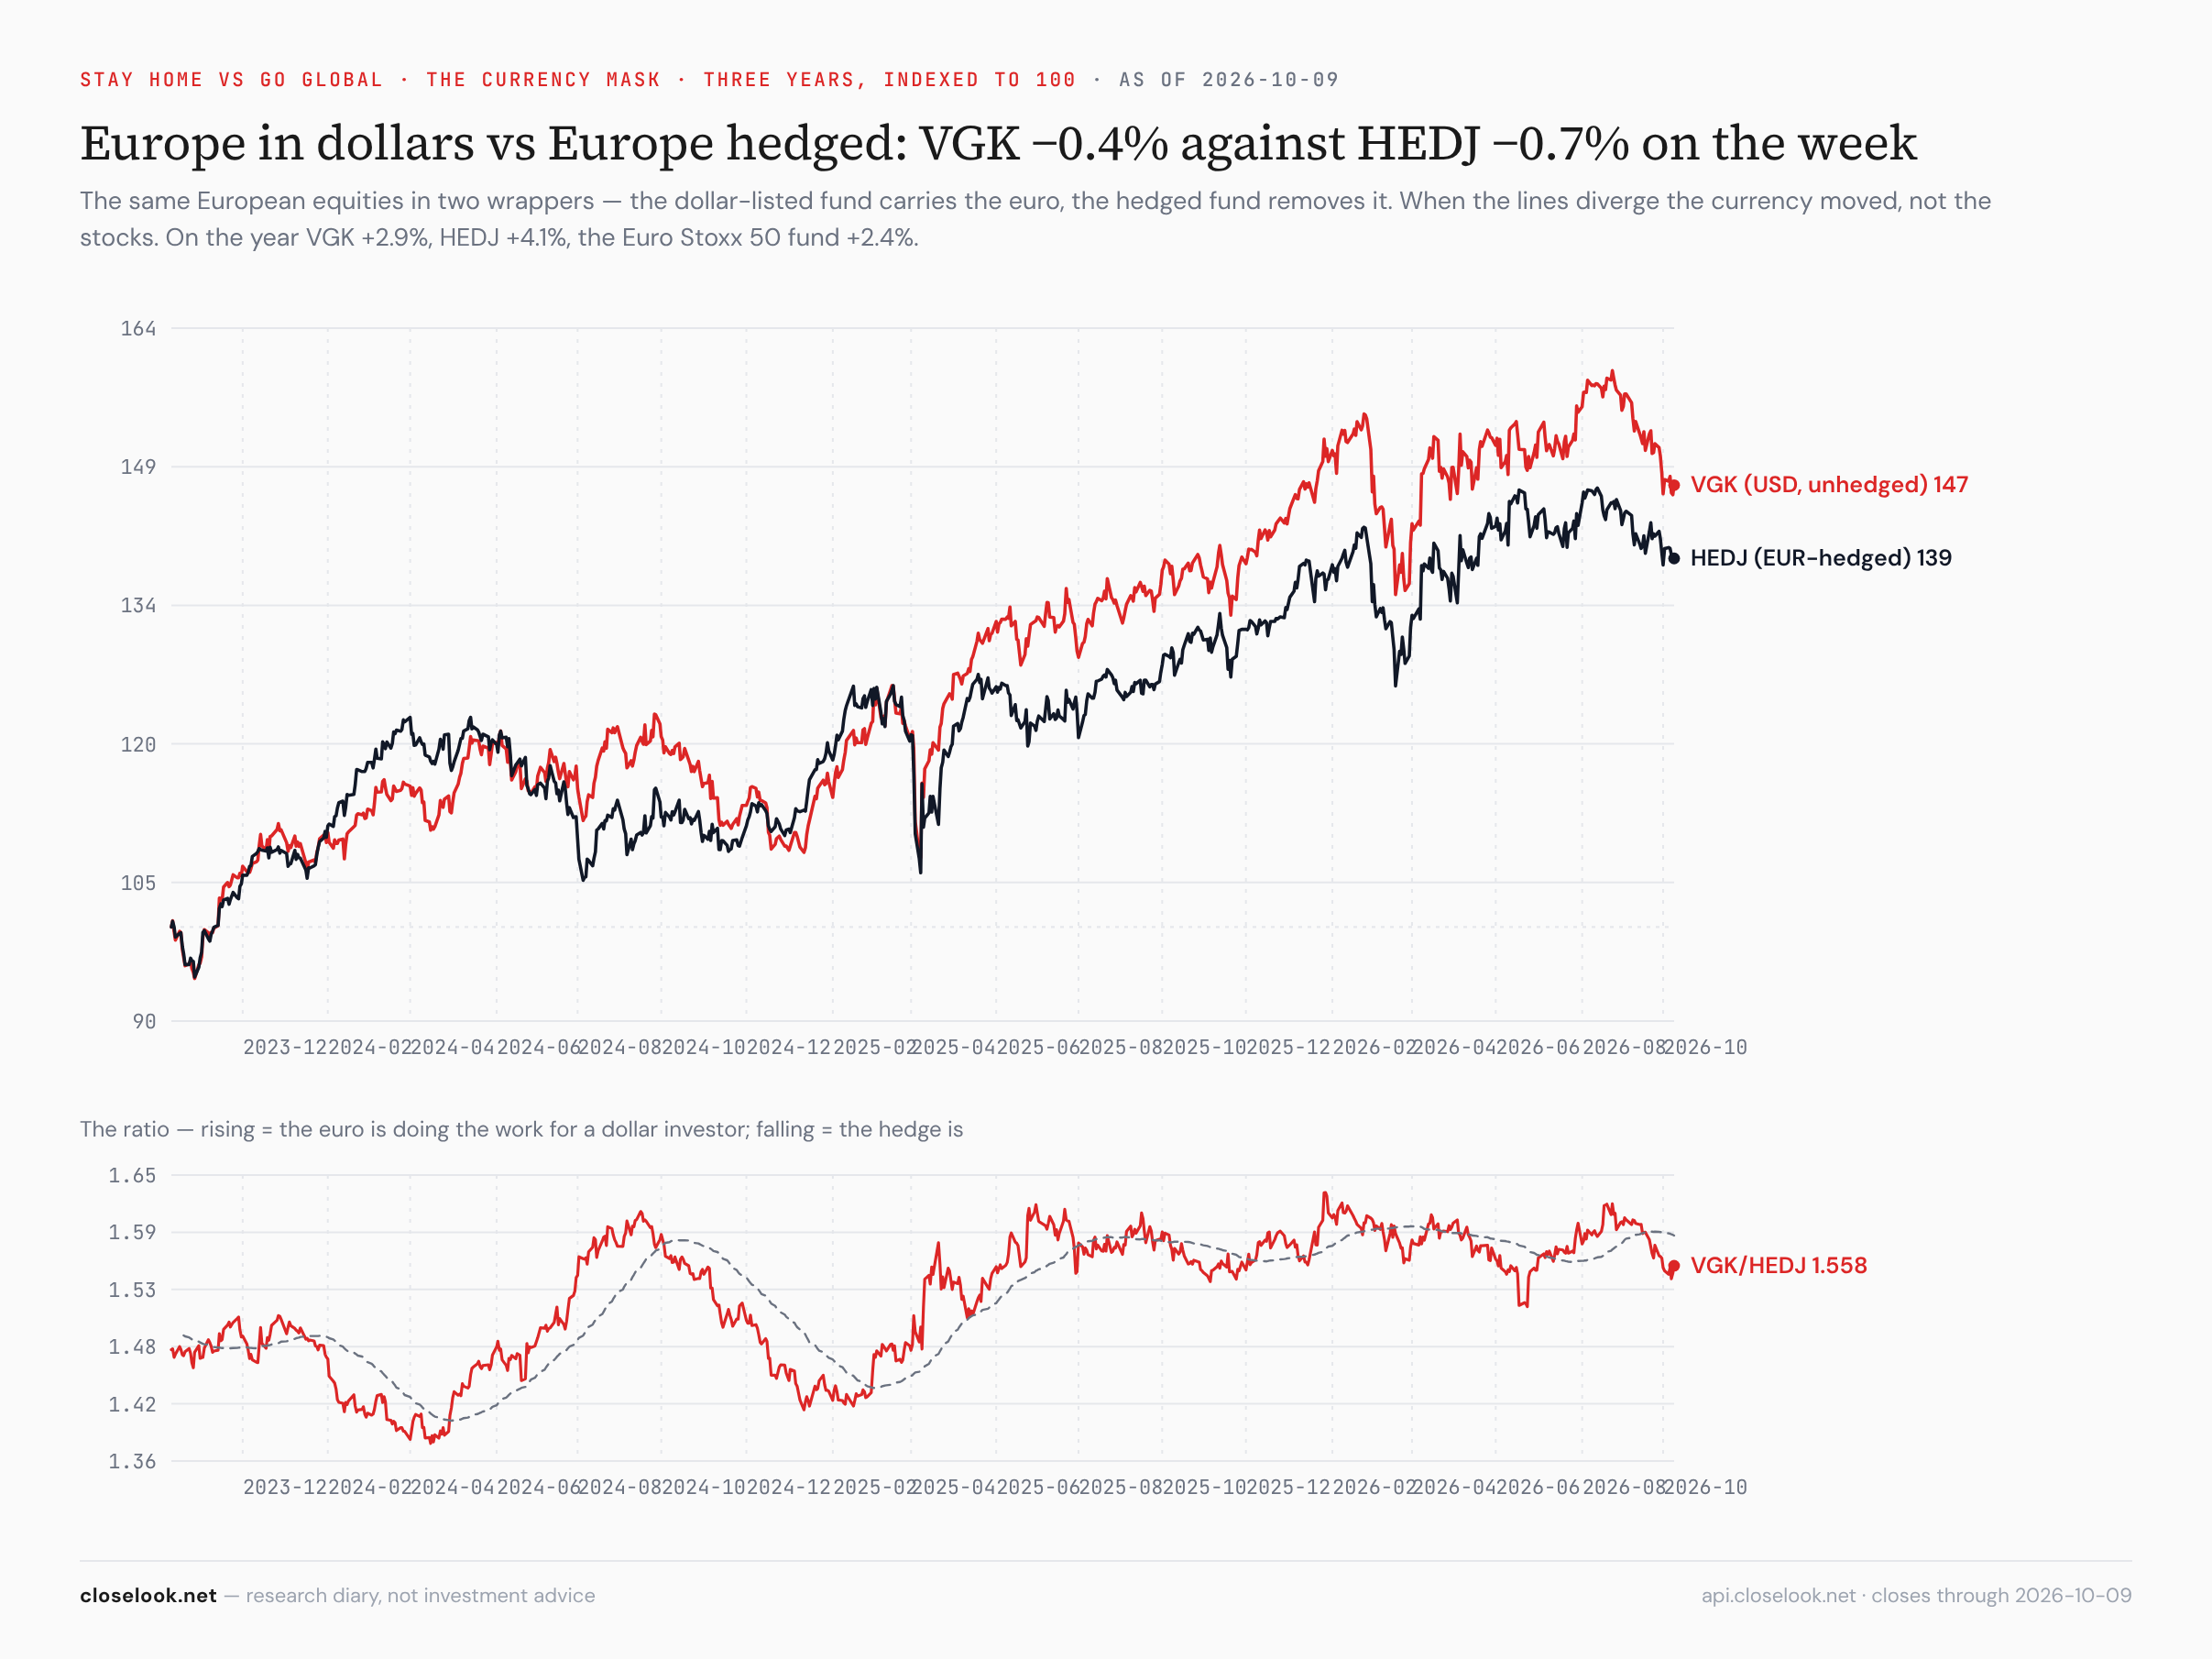
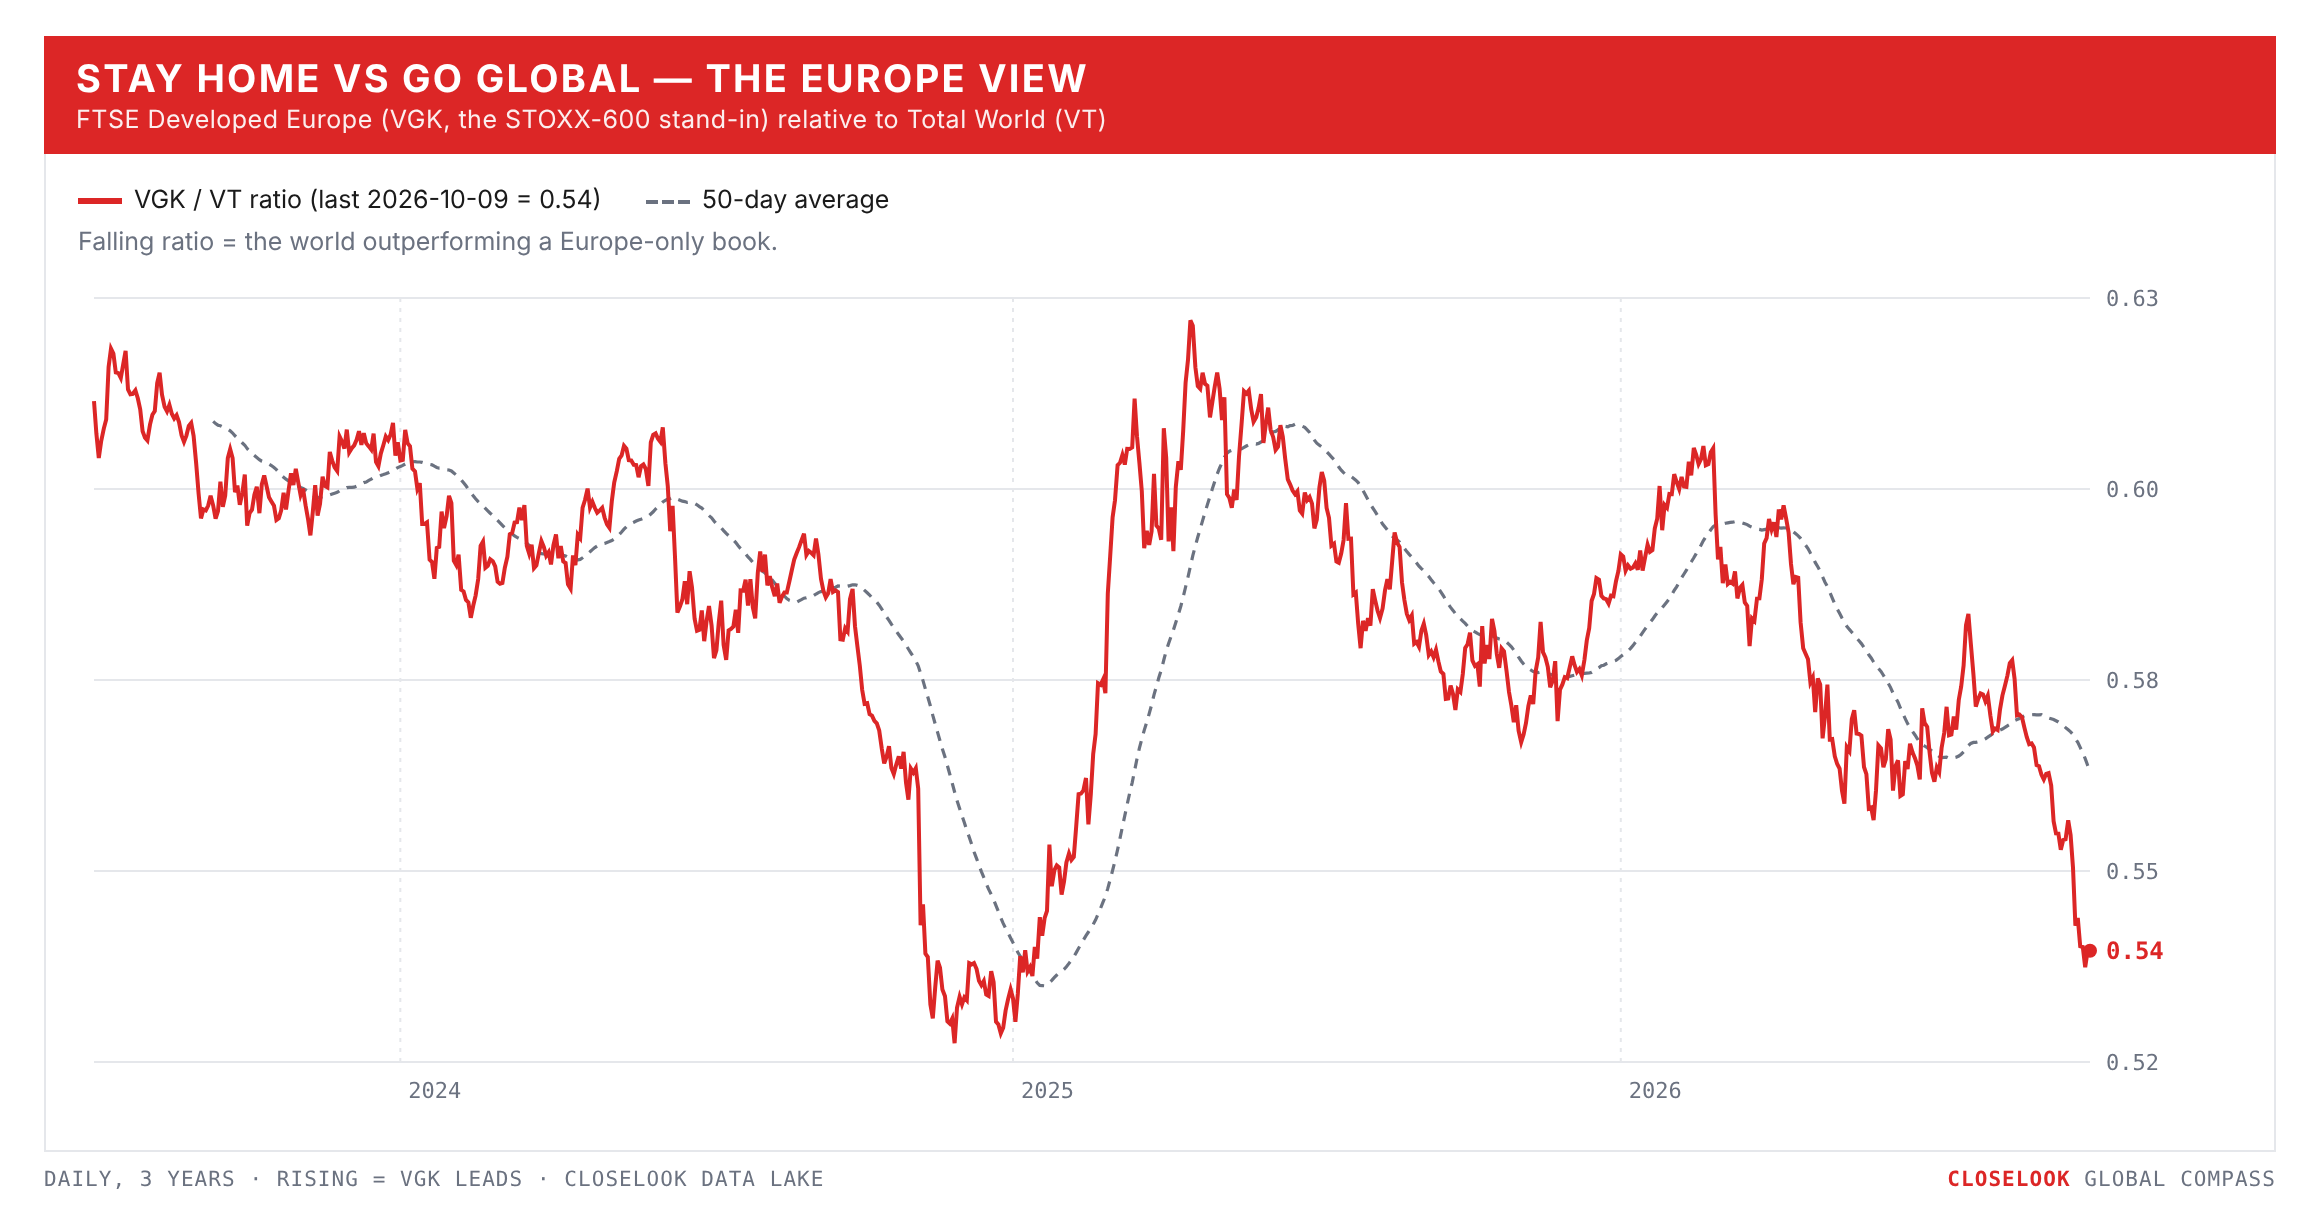
Stay home vs go global — the Europe view: the core down, the edges up. In local terms: the STOXX 600 flat (+0.03%), the Euro Stoxx 50 −1.04%, the DAX −0.57% to 25,087, the CAC −1.33% to 7,792, Spain's IBEX −0.27% — and outside the euro the FTSE 100 +0.86% to 10,552 and Switzerland's SMI +0.93%. The dollar-listed Europe fund fell 0.41%, the euro-hedged one 0.74% — the hedged fund holds the euro area's exporters, the unhedged one also holds Britain and Switzerland, which rose. The French fund closed Thursday at 41.32, its lowest close in a year.
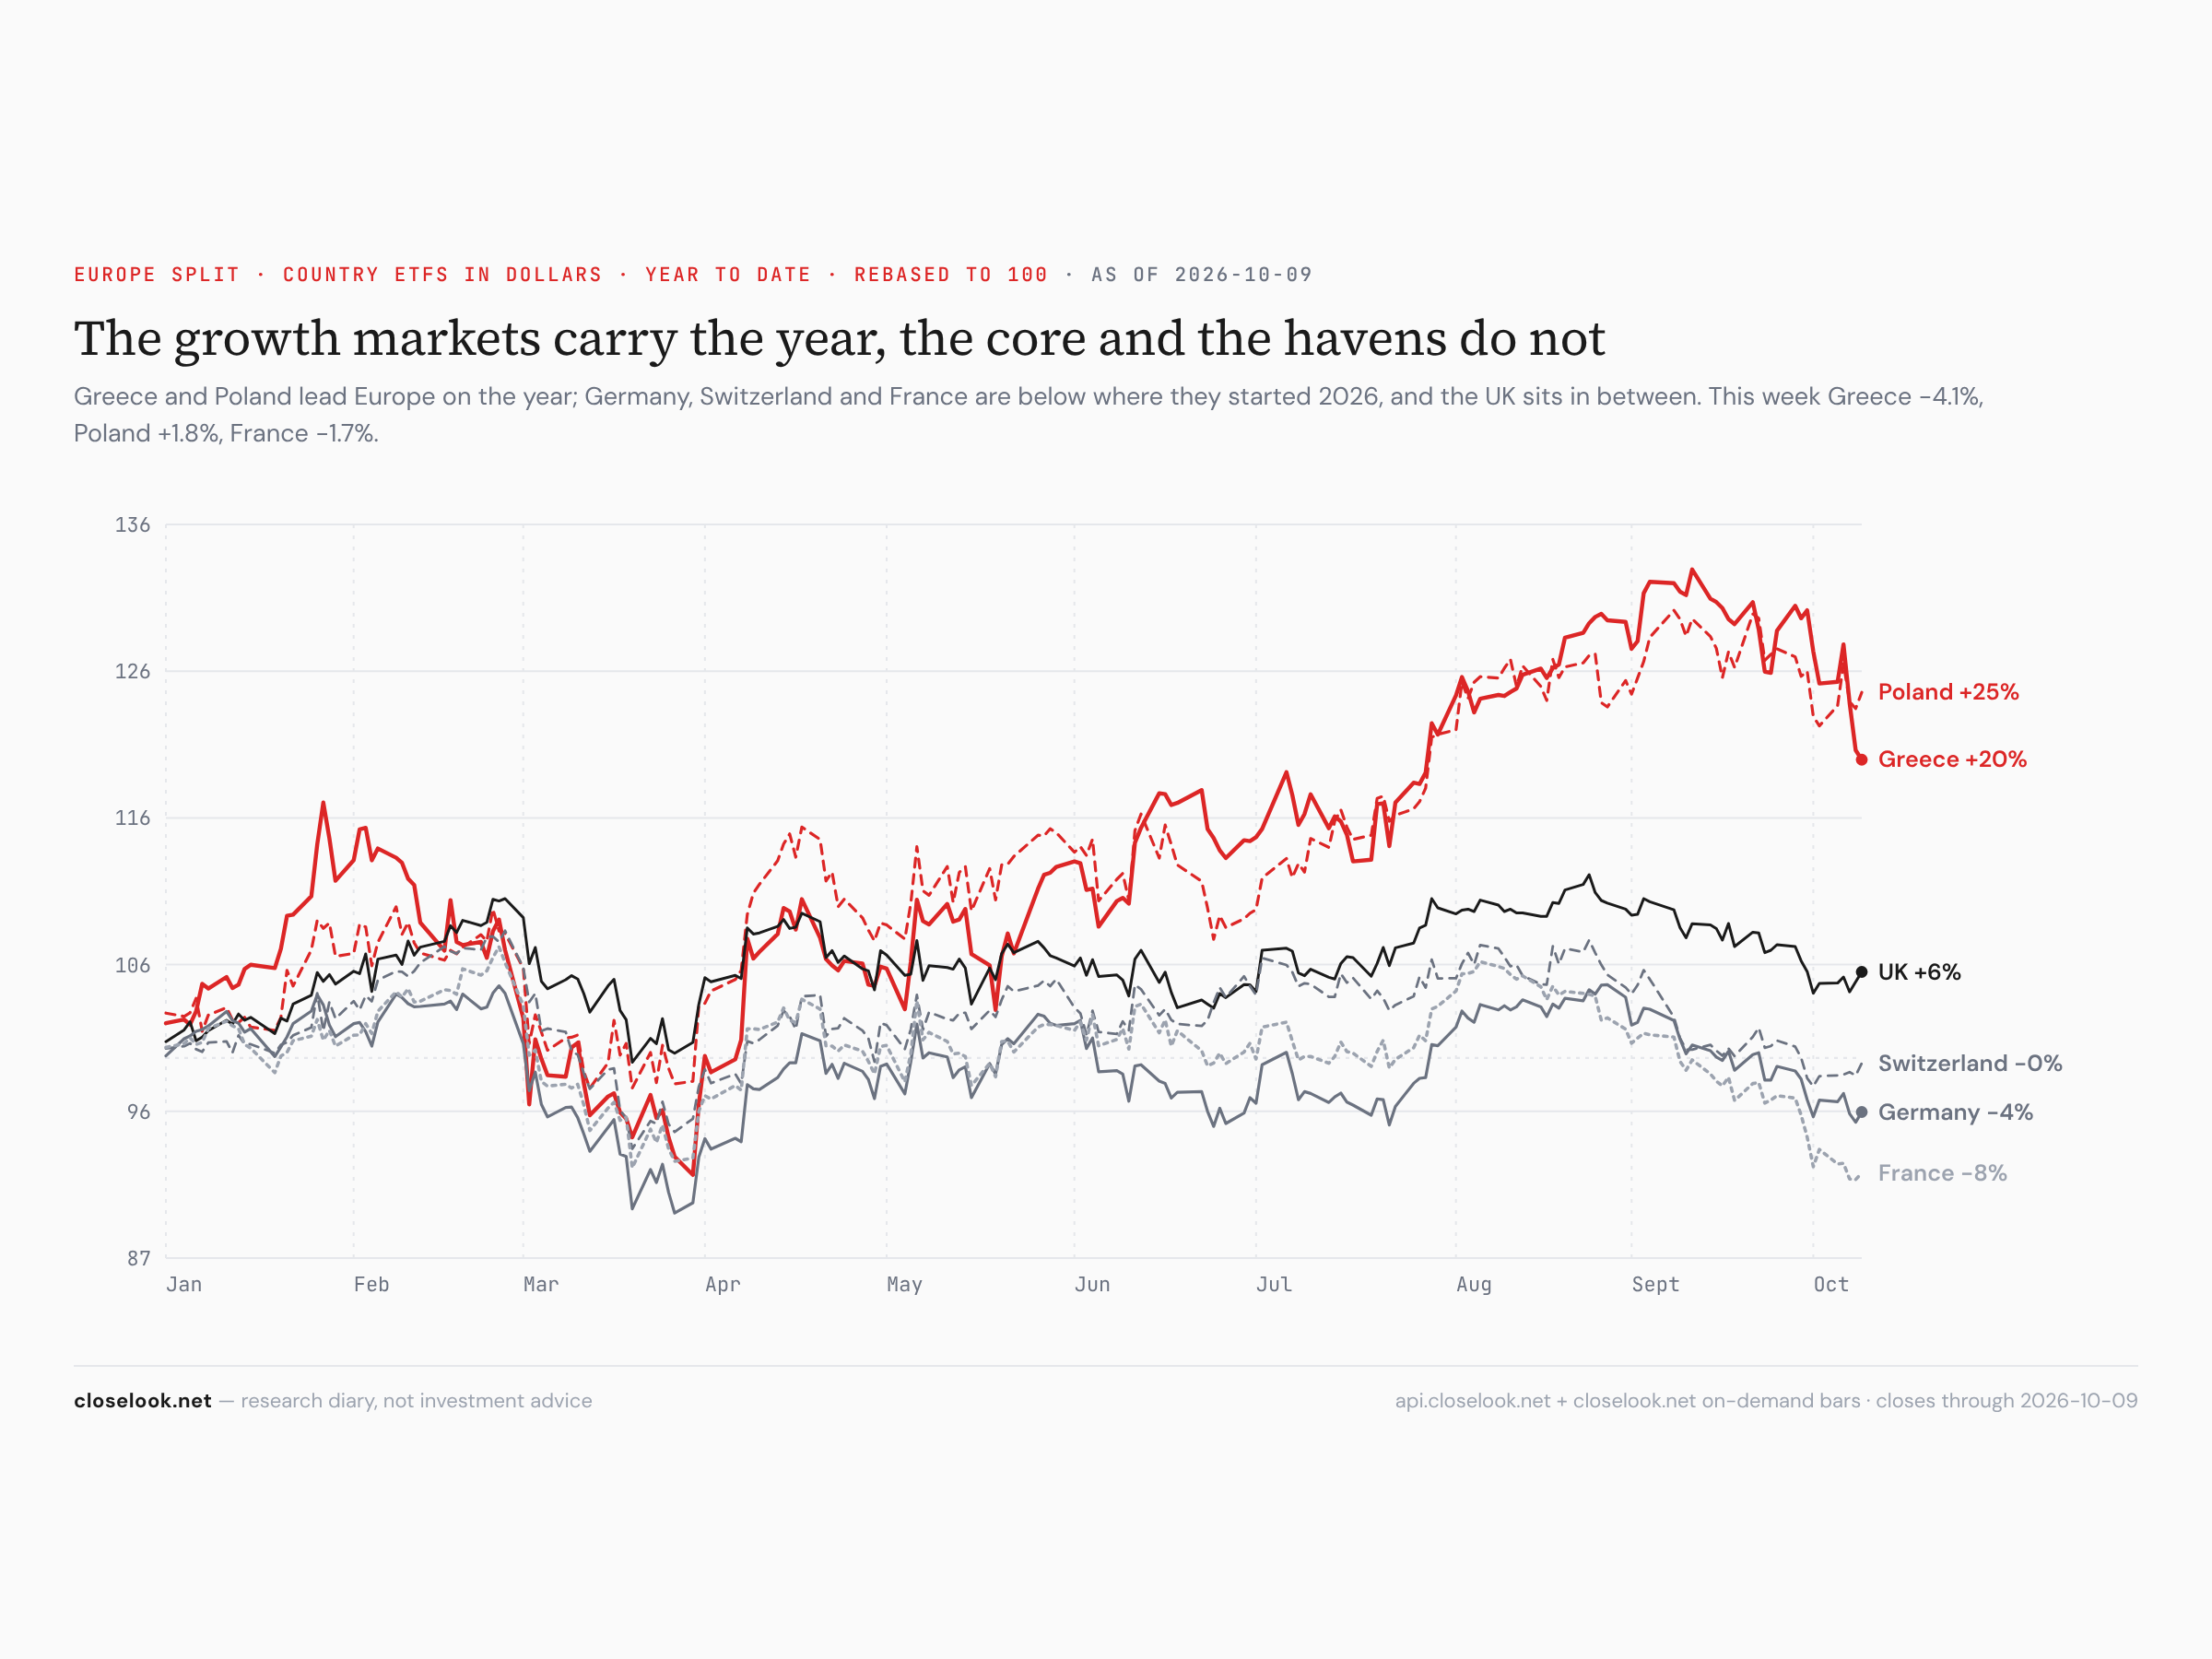
Europe split — the growth markets held. Poland +1.8%, Britain +0.7%, Switzerland +0.9% — against the Netherlands −1.8%, France −1.7%, Austria −3.1%. The Netherlands and Austria are Europe's chip-equipment and supplier markets, and they fell with the chips; the euro core fell with the euro. Last week both growth markets fell harder than the core; this week Poland rose against it. On the year: Poland +24.5%, the Netherlands +16.9%, Austria +14.1%, Britain +5.8%, Switzerland −0.4%, Germany −3.6%, France −7.7%.
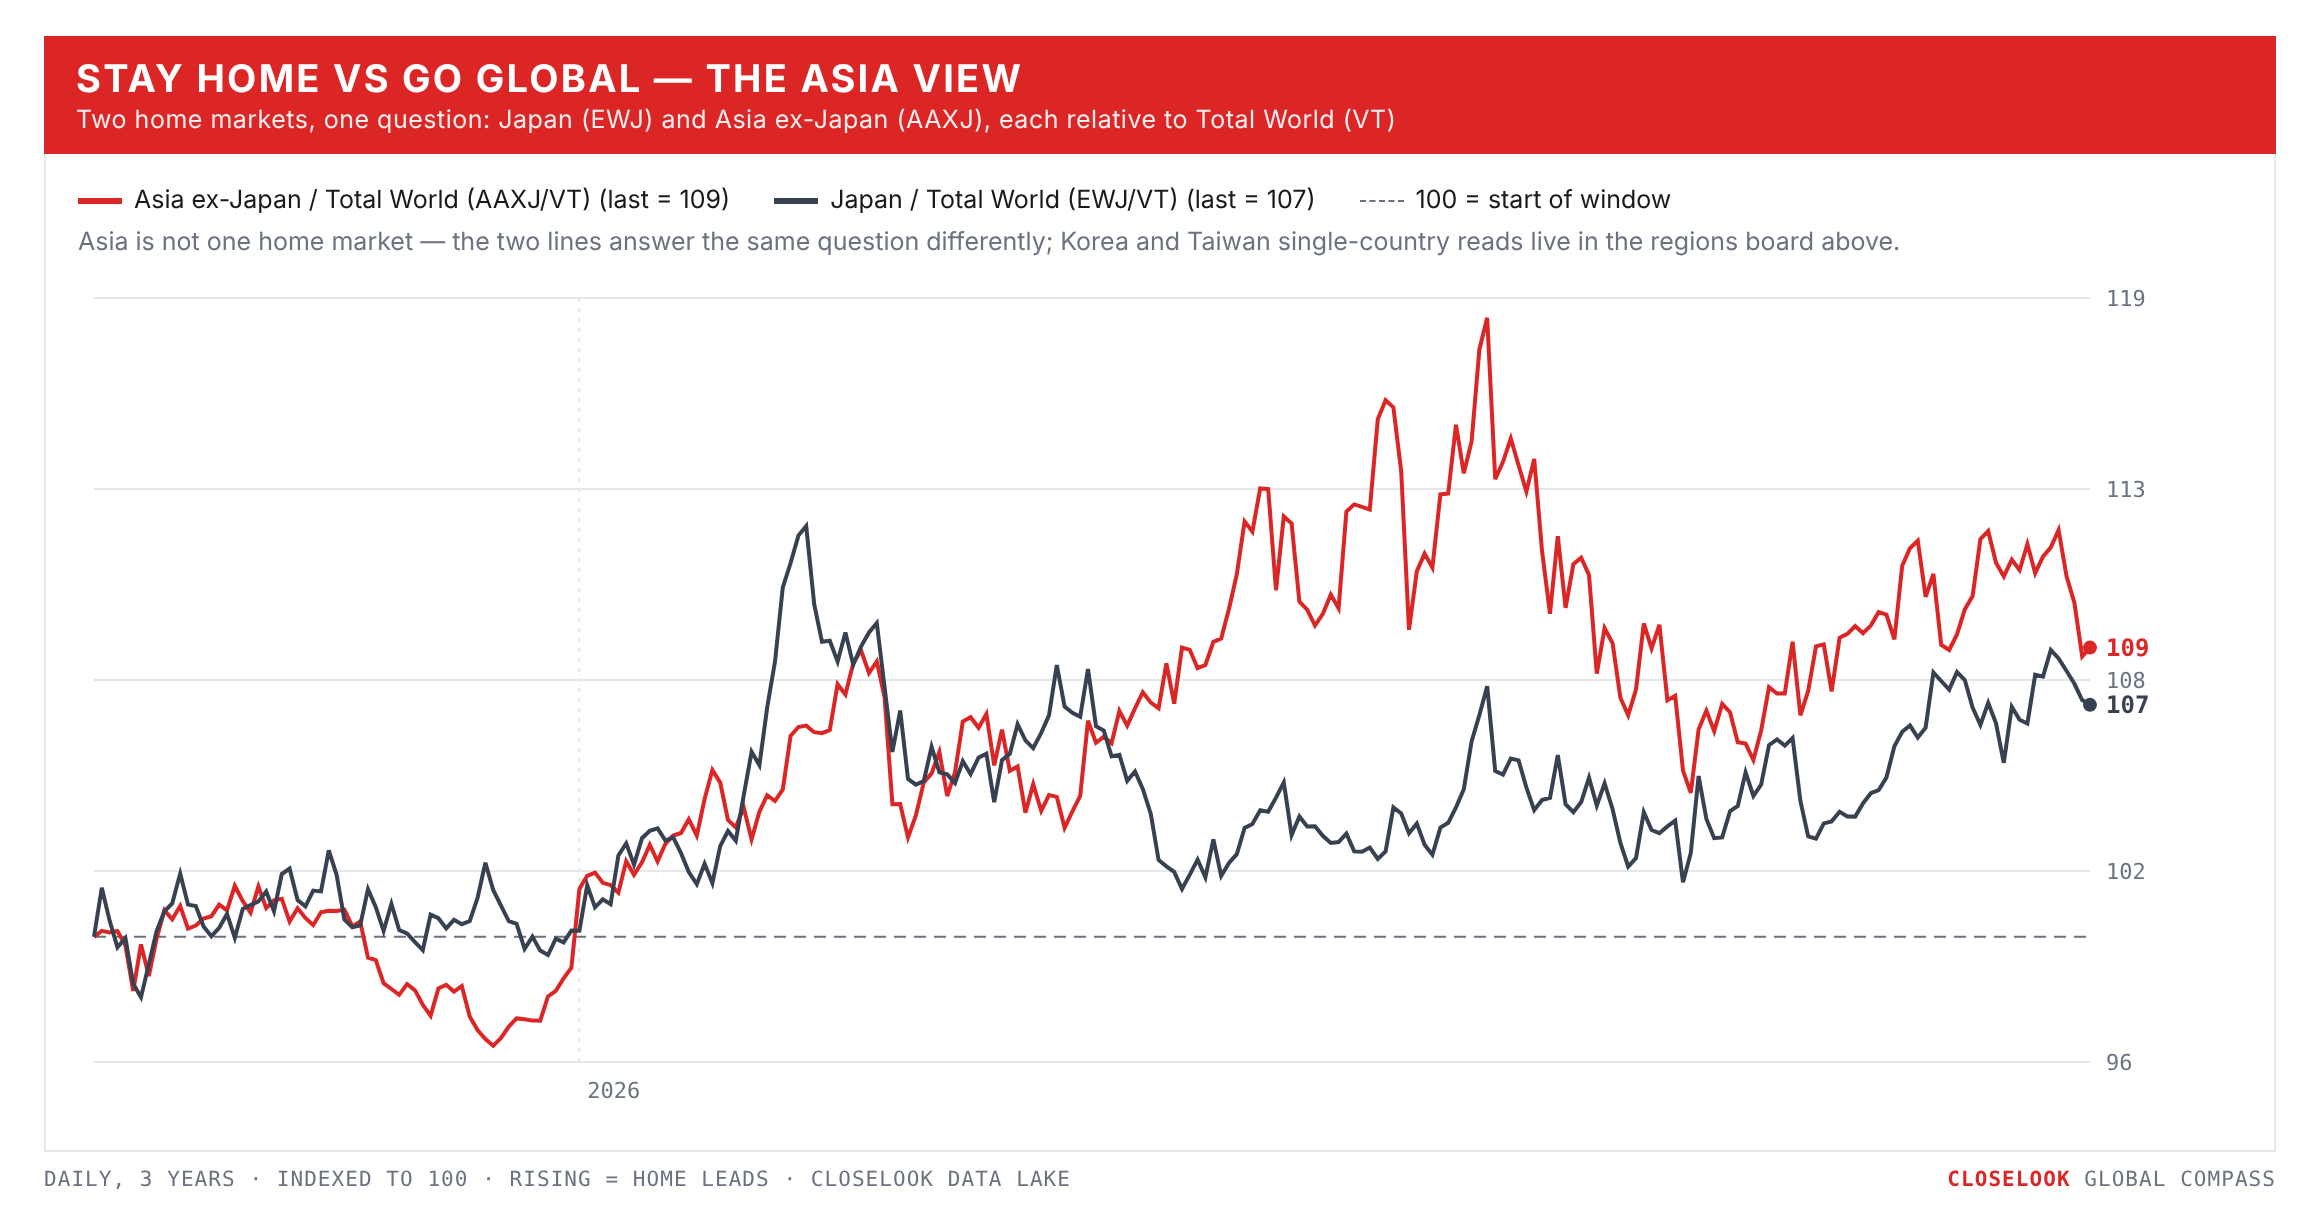
Stay home vs go global — the Asia view: the corridor fell, the rest held. Korea: EWY −7.63%; the Kospi −5.4% to 6,626 by Thursday, the tech-heavy Kosdaq −0.1%. Taiwan: EWT −1.74% after Monday's record; the Taiex +1.7% to 49,313 by Thursday, after a record 49,823 on Tuesday — the local market up, the dollar fund down, because the fund traded a Friday on which Taipei was shut. Japan: the Nikkei +1.06% to 69,031, the TOPIX +0.34%, the dollar fund −1.07% as the yen weakened. India: the Sensex +0.78% to 72,472, after 71,593 on Thursday — another lowest close in a year — the dollar fund −1.05%. Hong Kong's Hang Seng rose 1.0%.
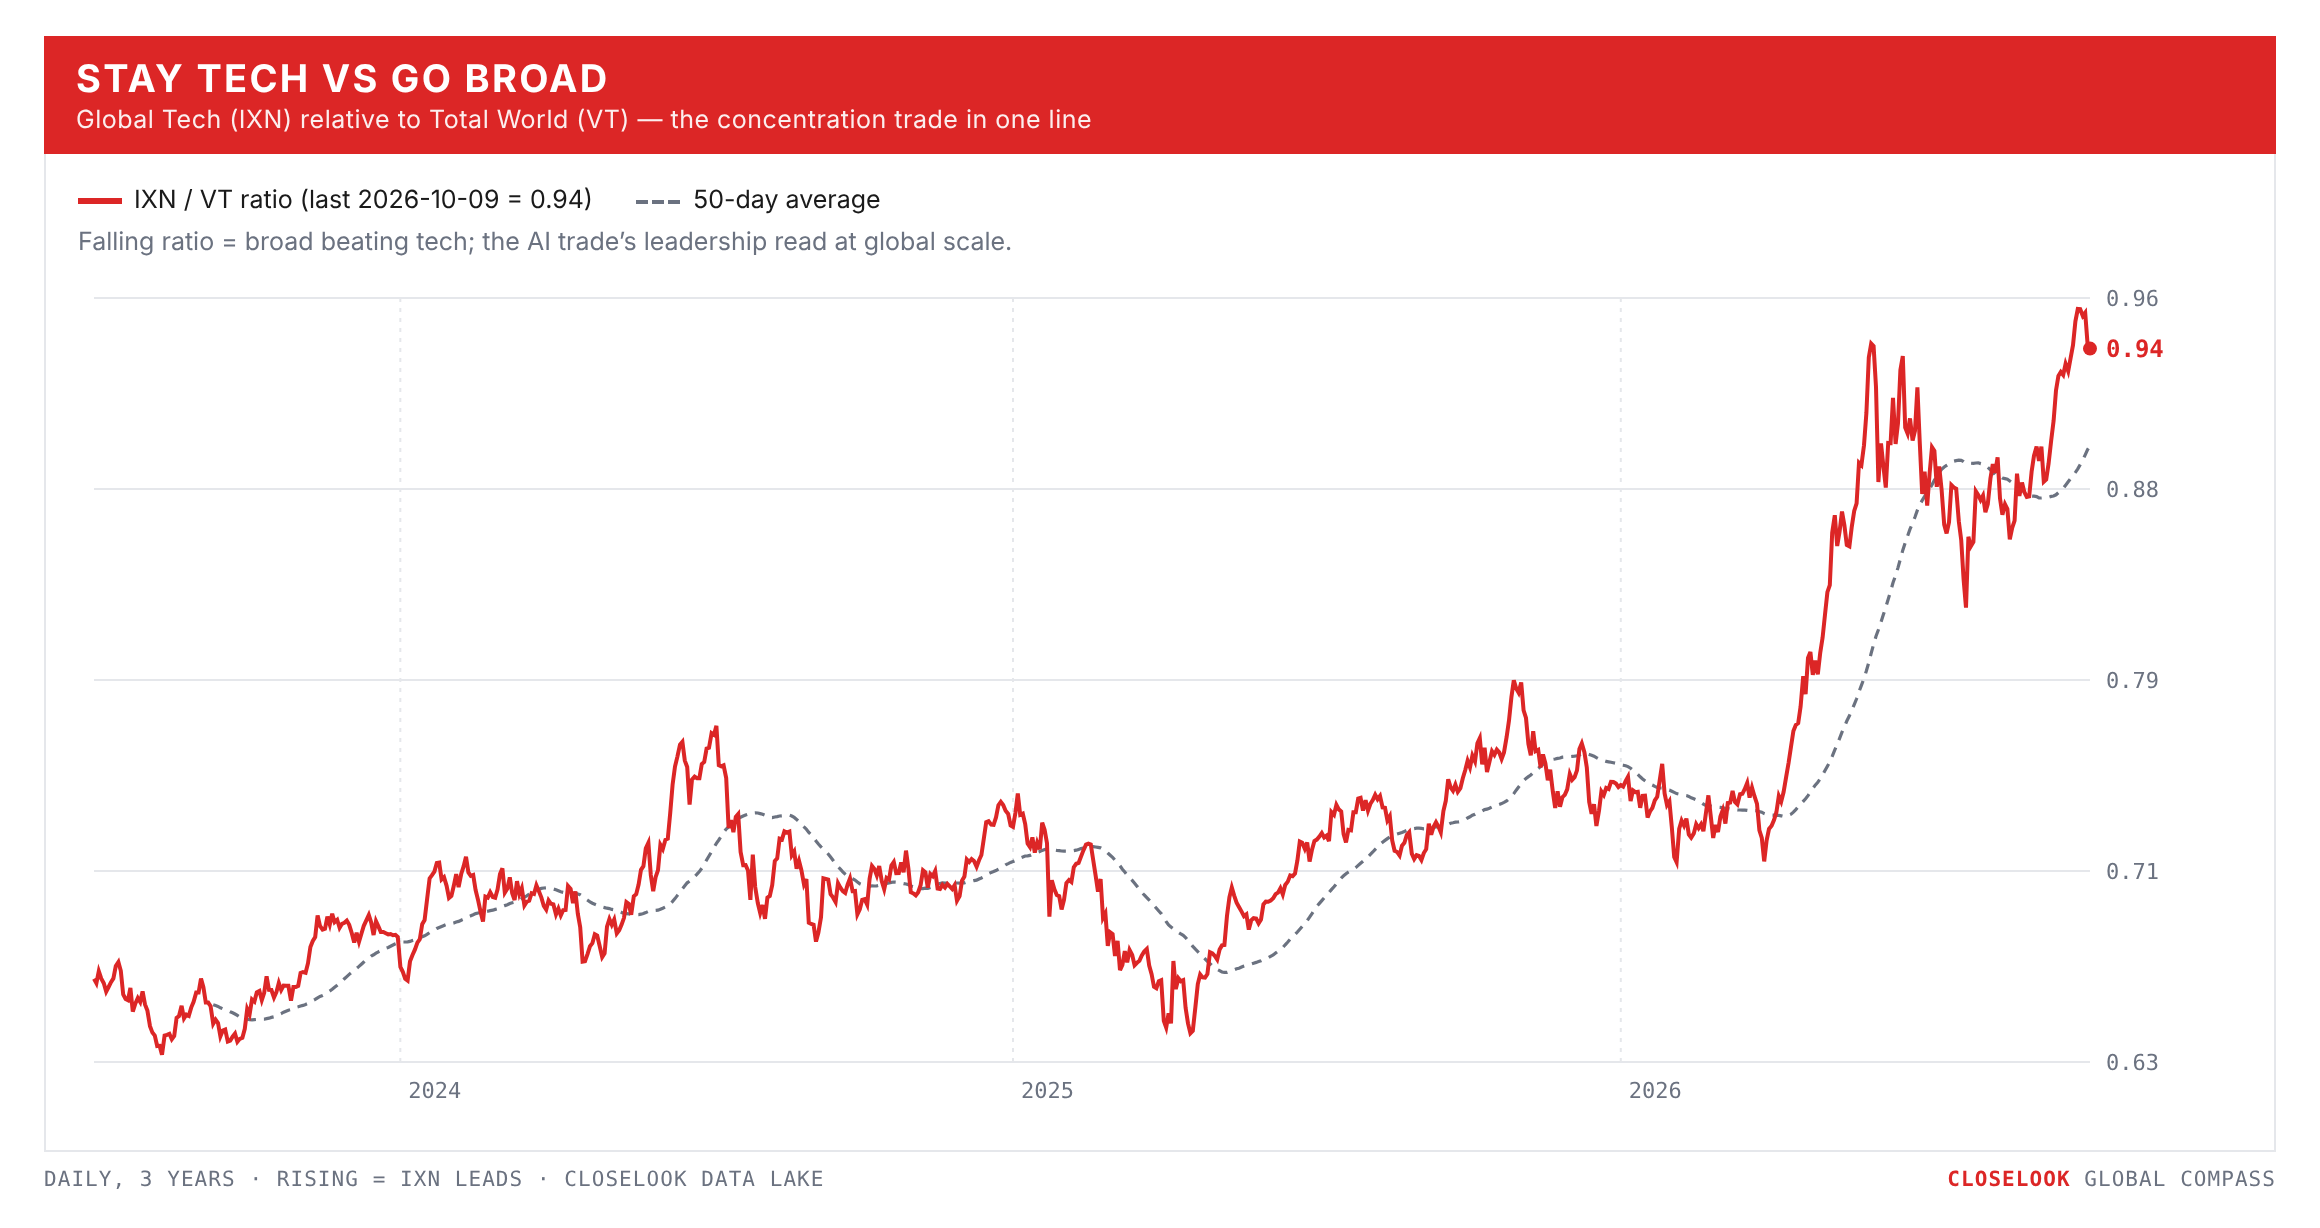
Stay tech vs go broad. This week broad won. The equal-weight S&P +1.58% against the S&P's +1.16% and the Nasdaq 100's +0.23%; the world +0.44% against global tech's −1.38%. On the year tech still leads by a distance — global tech +42.7% against the world's +13.3%.
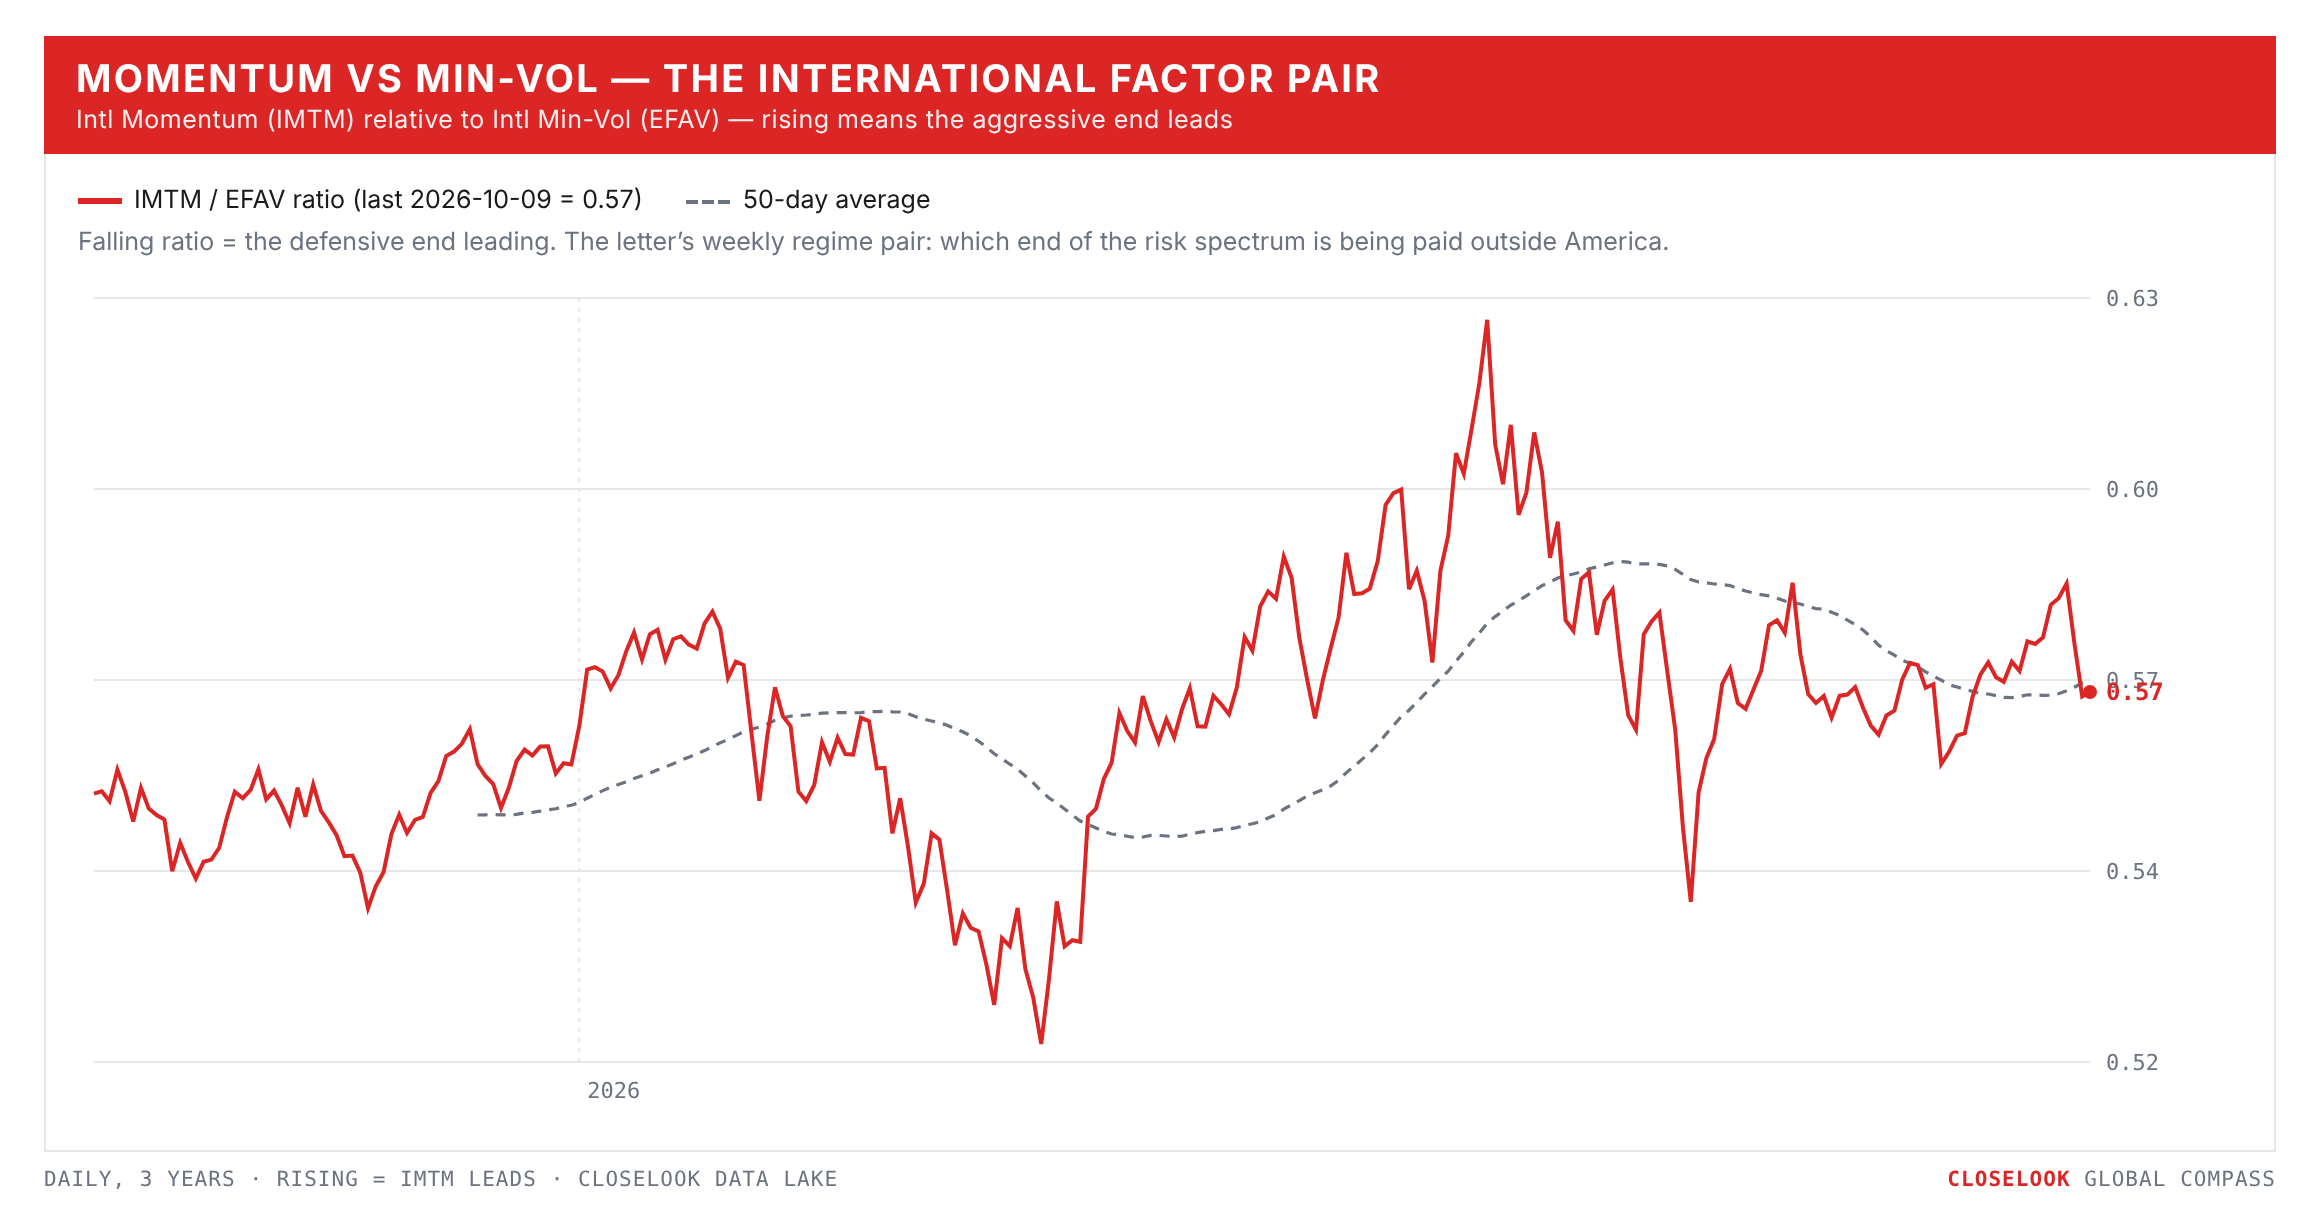
Momentum vs defensive — defensive, clearly. International momentum fell 1.41% to 52.30; international min-vol rose 0.75% to 91.64; global min-vol +1.56%. On the year momentum still leads, +9.0% against +6.3%. Momentum outside America is heavy in the chip exporters; min-vol is staples, utilities and health care — the week in one pair.
One more pair: value edged growth. EAFE value −0.38% against growth −0.64%. On the year value leads +9.5% against +5.6%.
The Closelook letters — where this one sits. The house thesis, compressed: the stock market is a growing system at the aggregate level in which most constituents slowly fade while a small group massively outperforms — and that group changes dynamically; it never stays static. Own the aggregate, know the current winner group, watch for the rotation. This week showed a rotation inside the winner group, not out of it: from the AI builders to the AI sellers, from the chip countries to the market that sells software. This letter reads the map (regions, currencies, rates); Sunday's US letter reads the tape and its levels; Sunday evening's Hypergrowth letter reads the names.