Source page — copy text into Substack/LinkedIn, upload the visuals. noindex · not public

Closelook@US Stock Markets · Weekly Edition
S&P 500 — The Market Trades a Rate Peak, and the Rally Broadens
The Fed's minutes pointed to another rate hike and the ten-year real yield touched its highest level since 2008 — and the market traded as if the top in rates were in. Utilities, staples, health care, financials and the consumer names rose; the equal-weight S&P beat the Nasdaq 100 by more than a point; the Nasdaq without its tech stocks rose 2.4% a week after its year low. The bottoms came in a sequence — utilities on 28 September, financials on the 30th, staples on 1 October, health care on the 2nd, real estate on the 7th. The chips paid for it, down 5%, while software, cloud and security made highs of the year. The Nasdaq 100 fund held its confirmation line all week. What has not joined yet says how far the peak trade has run — homebuilders, regional banks and small caps fell.
Closelooknet is a reader-supported publication — to receive new posts and support the work, become a free or paid subscriber.
1 · This Week's Action
The index and the market under it. The S&P 500 fund rose 1.16% to 778.57 — a record close of 779.09 on Tuesday, through the August high of 777.88 this letter carried as the line above. The Nasdaq 100 fund rose only 0.23% to 751.27, after its own record close of 759.66 on Tuesday. The equal-weight S&P rose 1.58% — the average stock beat the index, and the index beat the Nasdaq. Small caps fell 0.92%.
Last week this letter wrote that the Nasdaq made its record while the market underneath made its low. This week the order turned: the Nasdaq 100 without its tech stocks rose 2.35% to 98.15, back above 96.92 — the first sign of a turn this letter named a week ago — while the tech half of the Nasdaq 100 fell 1.42%. The S&P 500 without tech rose 2.14%.
| Symbol | Name | Last | 5D | 1M | 3M | 6M | YTD |
|---|---|---|---|---|---|---|---|
| GLD | Gold Shares | 384.58 | +1.17% | -4.65% | +1.69% | -12.18% | -2.96% |
| SPY | S&P 500 | 778.57 | +1.16% | +2.12% | +3.57% | +14.51% | +14.17% |
| TOPT | iShares Top 20 U.S. Stocks | 35.5 | +0.82% | +4.66% | +6.51% | +18.41% | +13.67% |
| TLT | iShares 20+ Year Treasury Bond | 77.98 | +0.65% | -4.59% | -7.71% | -10.06% | -10.53% |
| USO | United States Oil LP | 148.2 | +0.56% | -1.18% | +35.95% | +16.73% | +114.29% |
| UUP | Invesco DB US Dollar Index Bul | 29.02 | +0.45% | +3.72% | +2.33% | +5.60% | +7.36% |
| IEF | iShares 7-10 Year Treasury Bon | 89.4 | +0.39% | -2.72% | -4.60% | -6.32% | -7.03% |
| QQQ | Invesco QQQ | 751.27 | +0.23% | +4.88% | +3.87% | +23.12% | +22.29% |
| SLV | iShares Silver | 54.78 | +0.07% | -9.78% | +1.18% | -19.90% | -14.96% |
| QTOP | iShares Nasdaq Top 30 Stocks | 39.75 | -0.09% | +5.66% | +4.85% | +24.37% | +24.37% |
| COPX | Global X - Copper Miners | 85.75 | -0.19% | -9.99% | +13.73% | +5.14% | +19.45% |
| IBIT | iShares Bitcoin | 46.55 | -2.47% | +5.10% | +29.99% | +13.79% | -6.24% |
Sorted by Weighted Alpha (leaders → laggards) · Barchart, close of week.
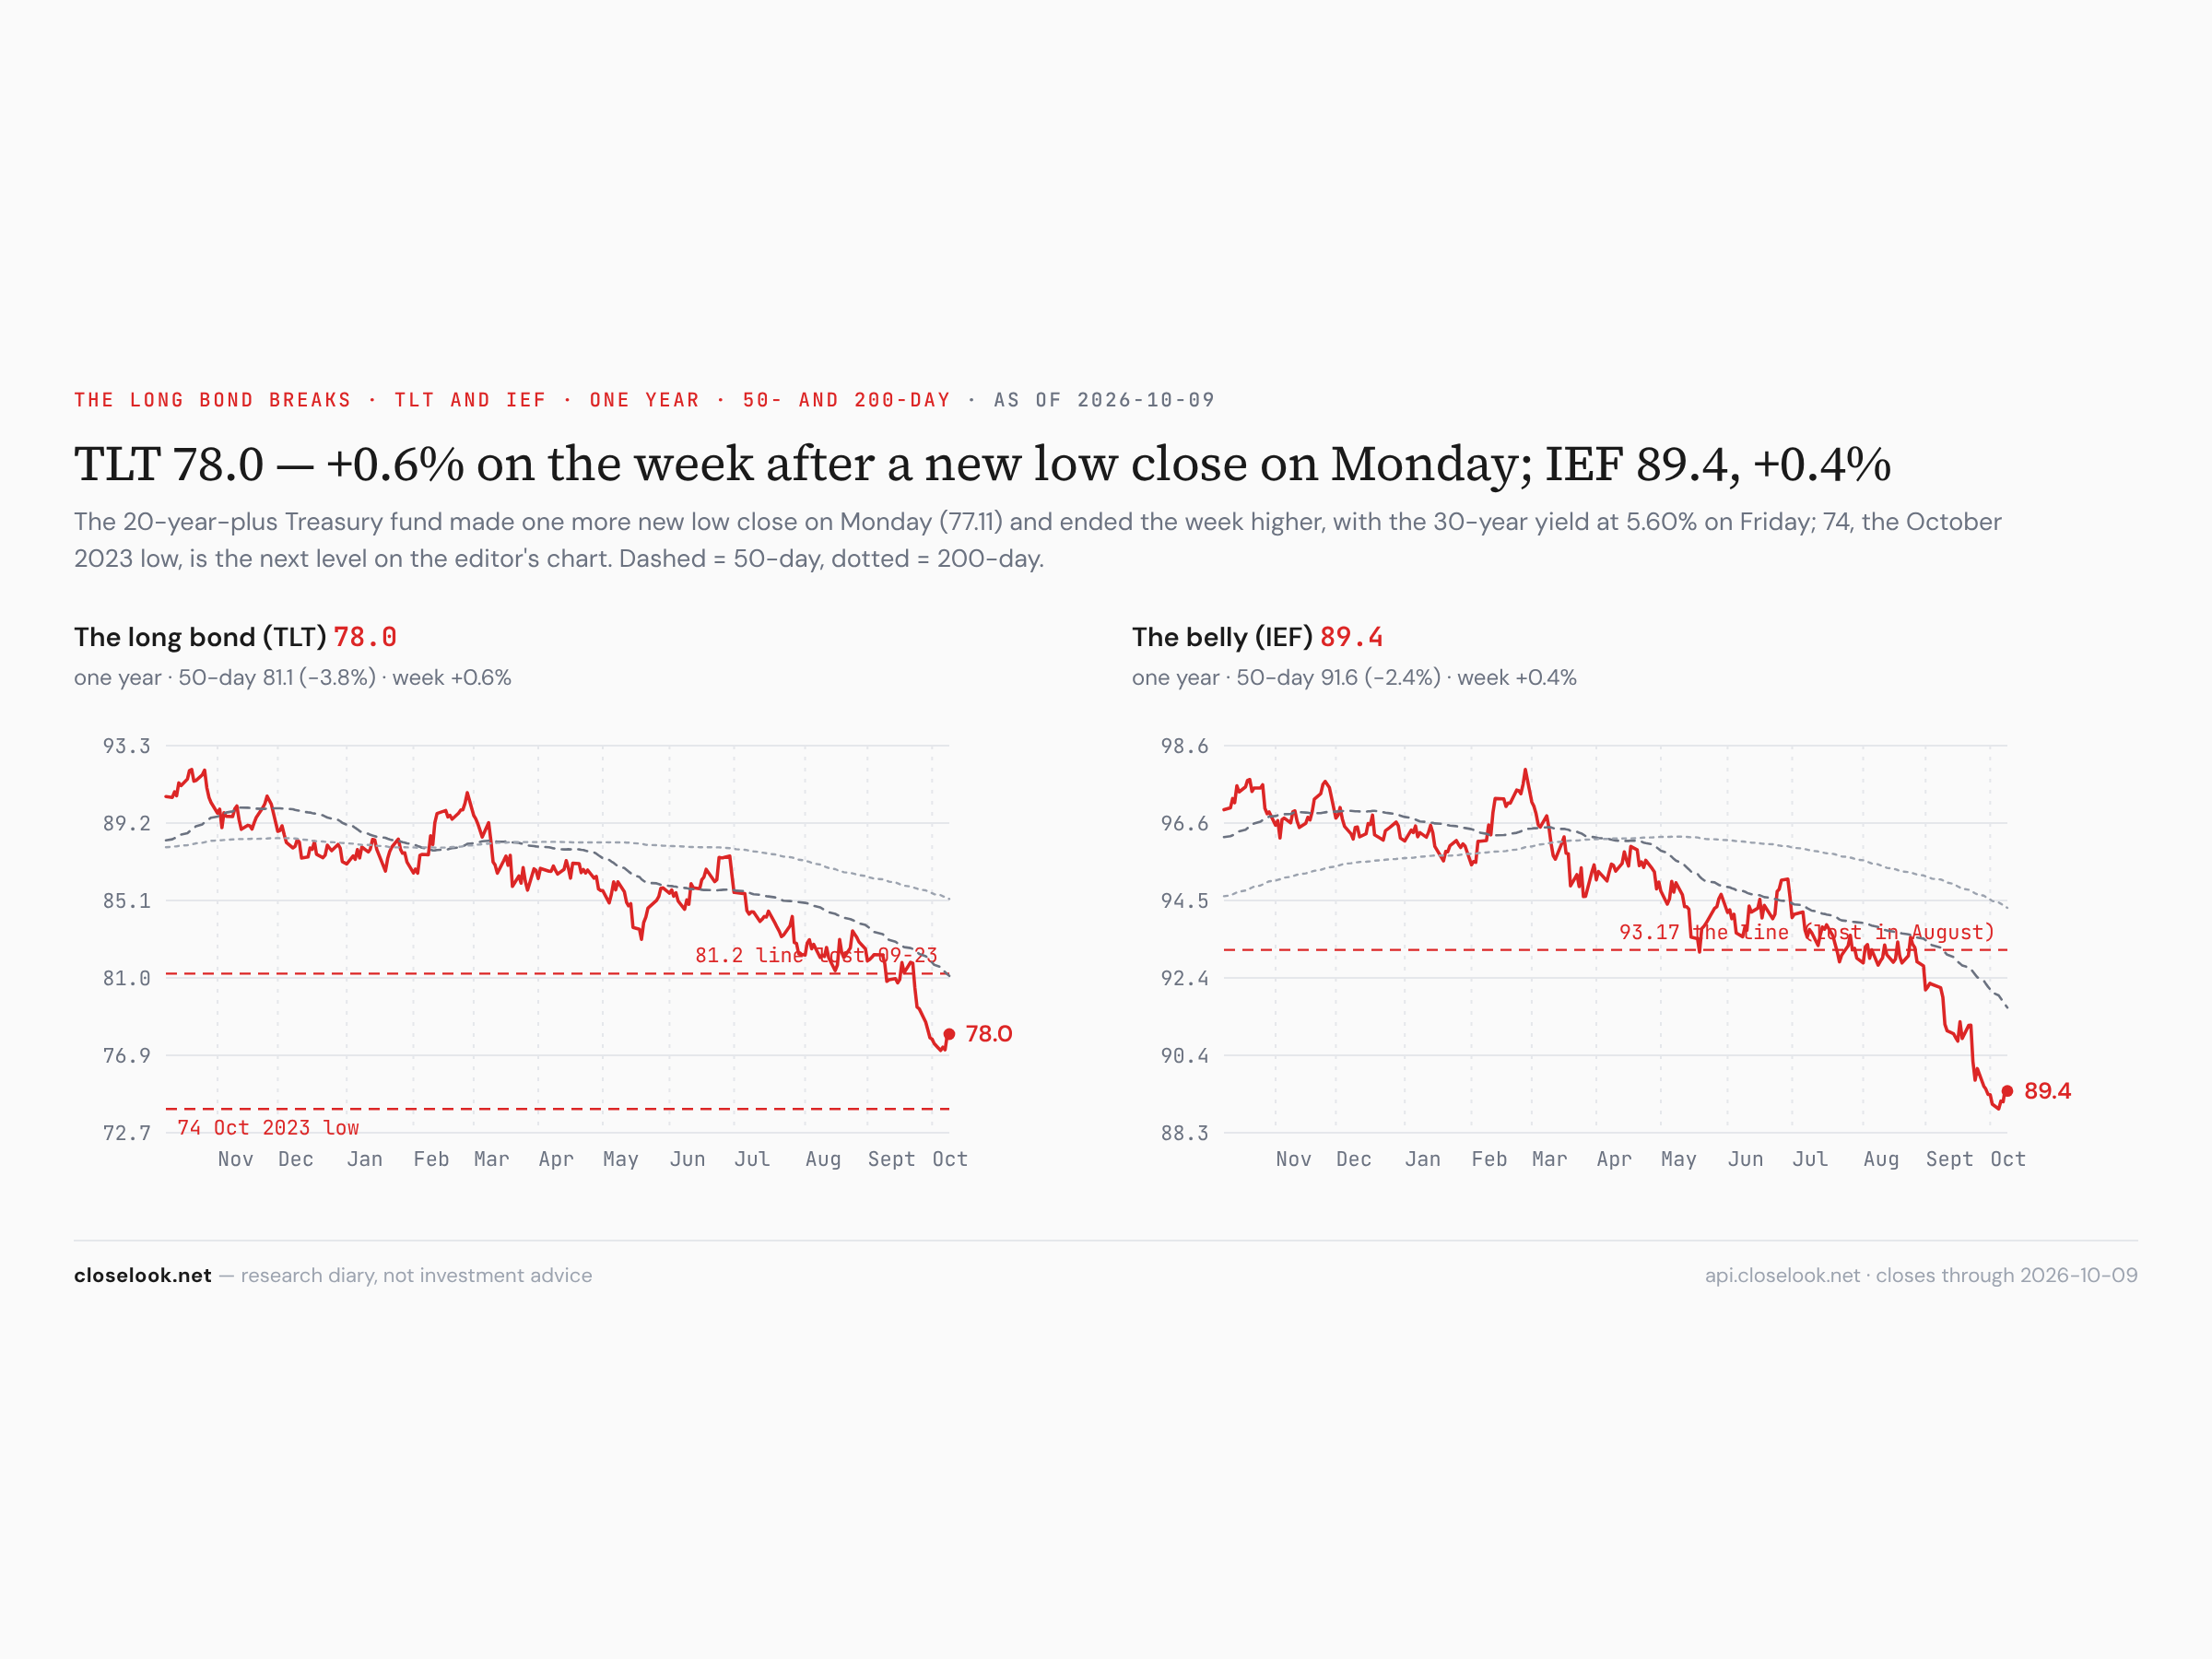
The macro — a hawkish week that traded like a peak. The news on rates was not friendly. On Wednesday the Fed's September minutes pointed to another rate hike by year-end. On Monday the ten-year Treasury yield touched 5.35%, and the ten-year real yield — the TIPS yield, what the government pays above inflation — closed at 2.95%, its highest since November 2008. By Friday the ten-year was back at 5.24% and the real yield at 2.91%; the long-bond fund made a new low close on Monday and ended the week up 0.65%. The market read the week the other way from the minutes: it bought the sectors that live on interest rates and sold the ones that live on next year's capital spending.
The eleven S&P 500 sectors
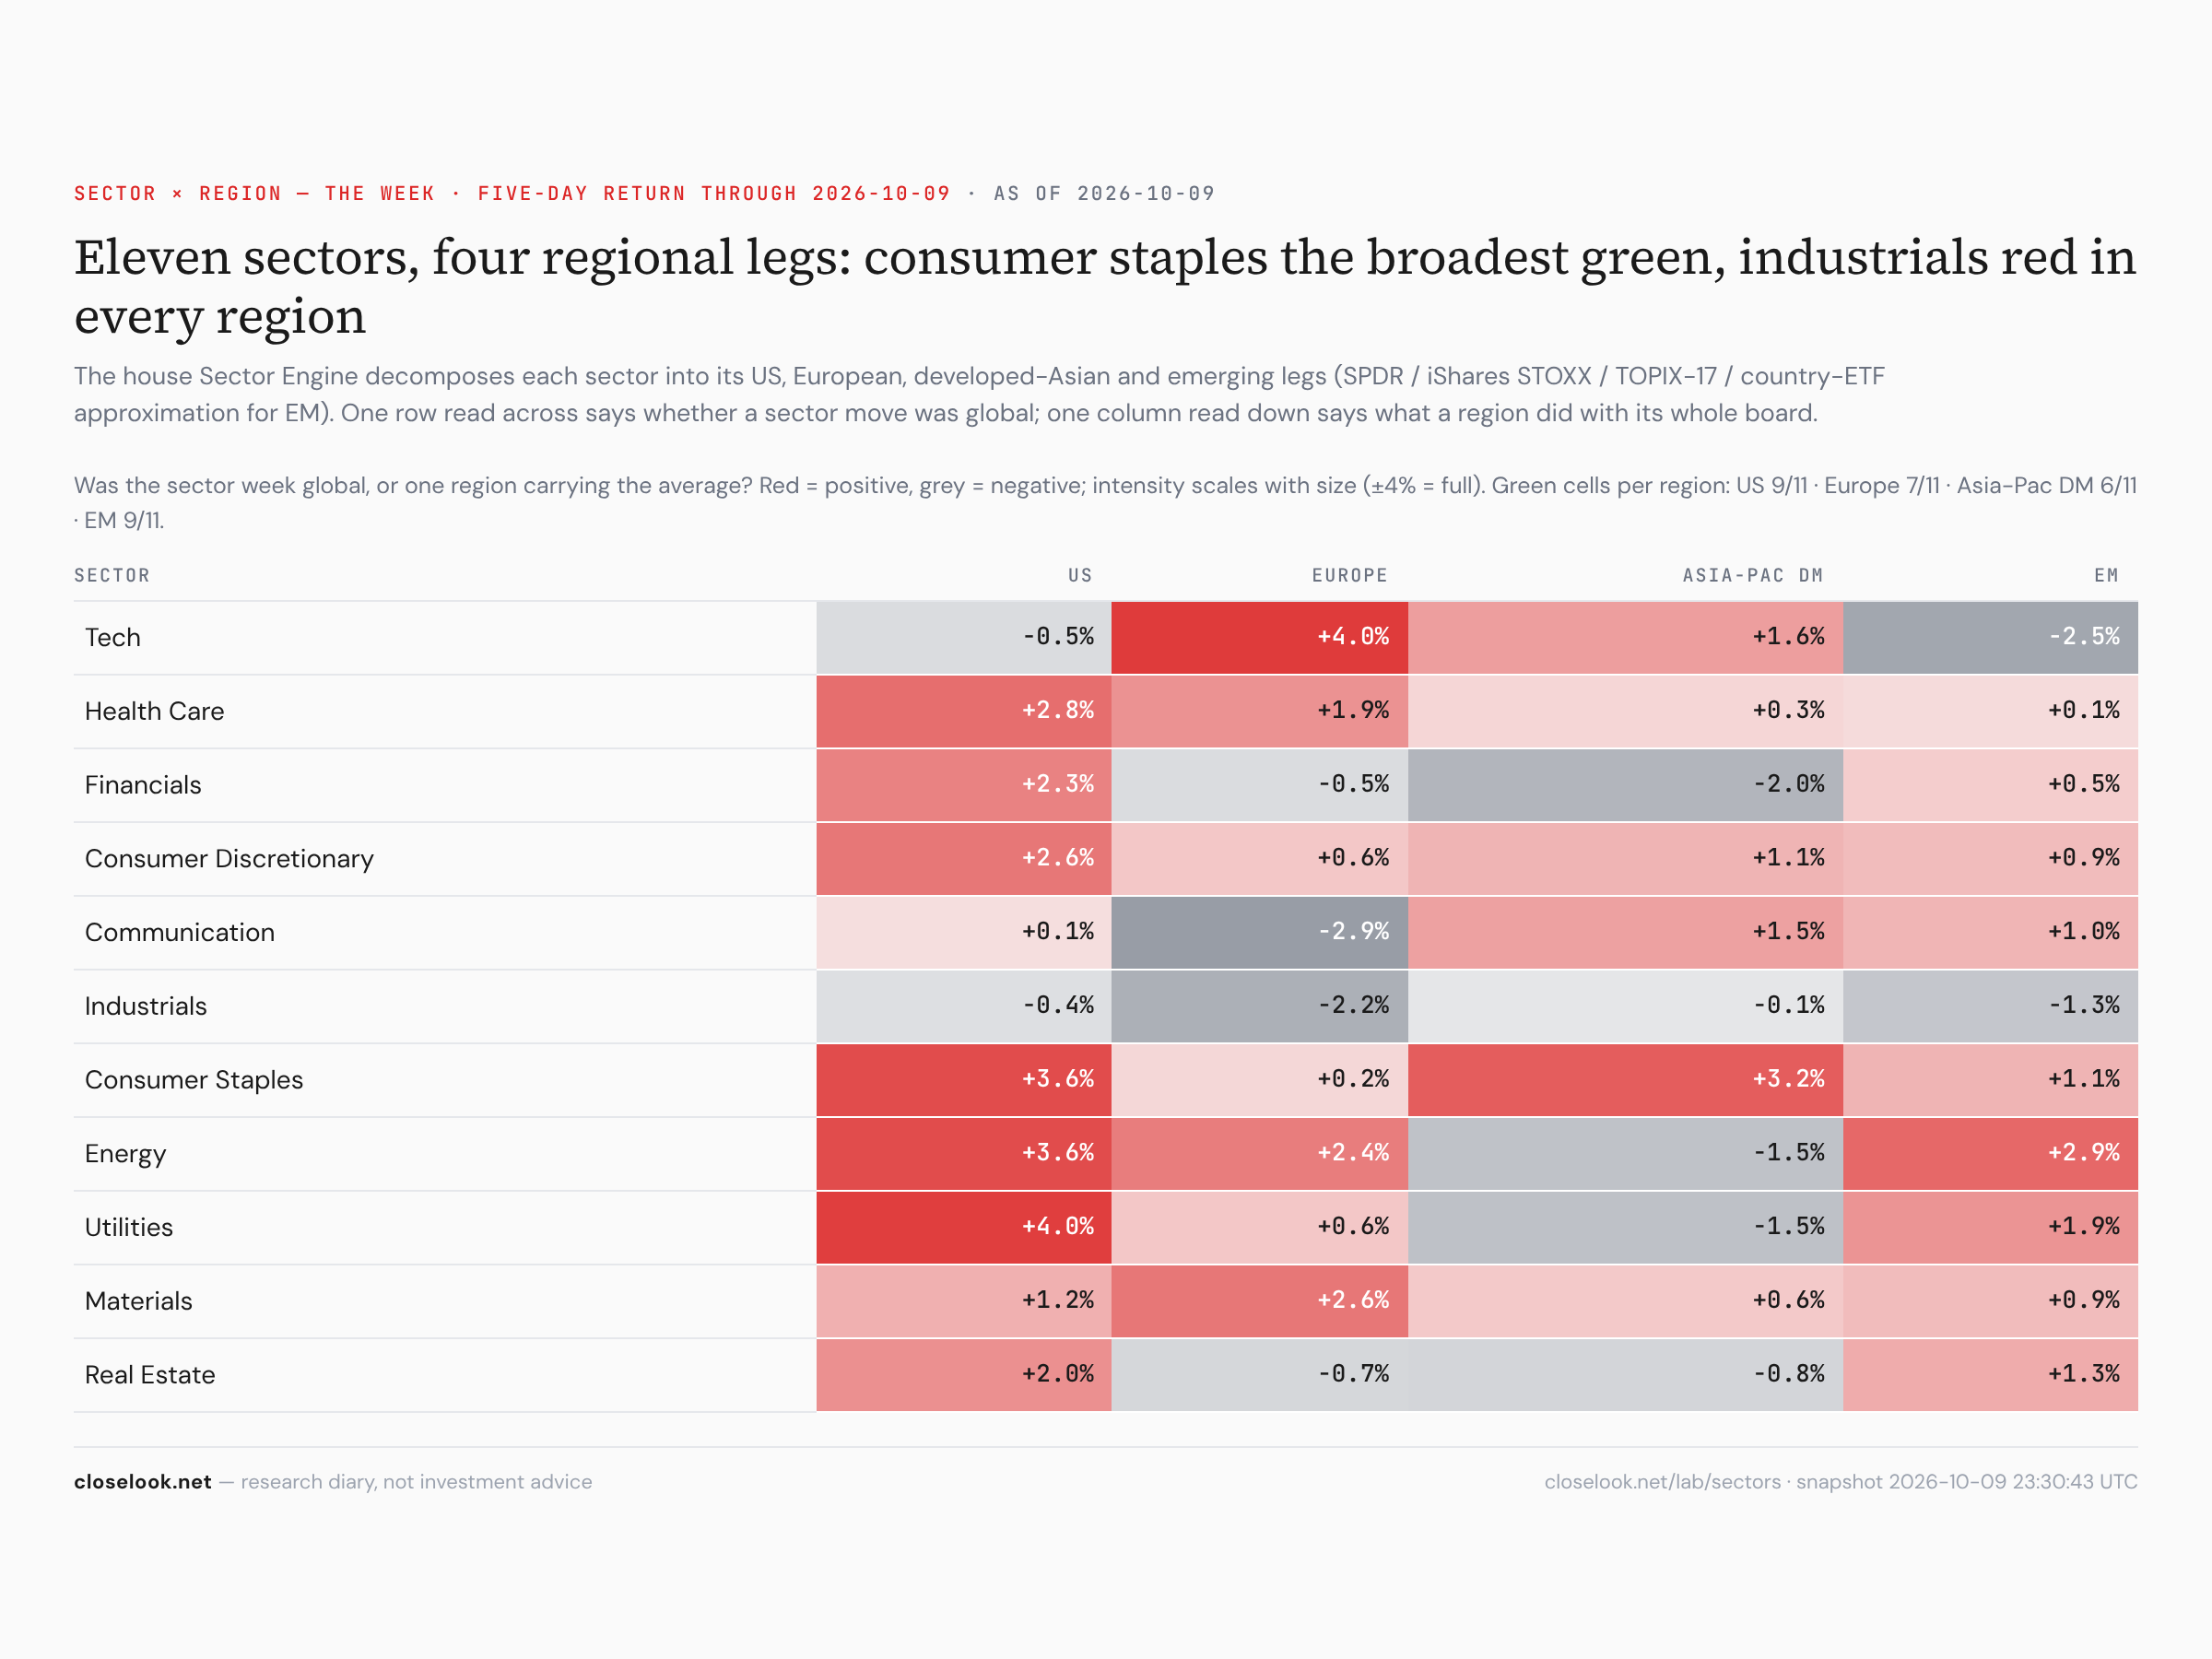
Ten of eleven green — and every one of the ten did better than technology. Utilities +3.97%, staples +3.60%, energy +3.60%, health care +2.79%, consumer discretionary +2.55%, financials +2.32%, real estate +1.96%, materials +1.17%, communications +0.05%. The two red: technology −0.52% and industrials −0.41%. Last week three sectors rose and technology was the best of them. This week technology was the worst.
| Symbol | Name | Last | 5D | 1M | 3M | 6M | YTD |
|---|---|---|---|---|---|---|---|
| XLU | Utilities | 41.41 | +3.97% | -3.56% | -8.24% | -12.17% | -3.00% |
| XLP | Consumer Staples | 83.43 | +3.60% | +0.46% | +0.28% | -0.02% | +7.40% |
| XLE | Energy | 65.08 | +3.60% | -0.35% | +18.72% | +13.52% | +45.56% |
| XLV | Health Care | 170.81 | +2.79% | +2.54% | +5.33% | +14.38% | +10.34% |
| XLY | Consumer Discretionary | 112.85 | +2.55% | +0.35% | -3.42% | +0.10% | -5.49% |
| XLF | Financial | 54.73 | +2.32% | -4.08% | -1.46% | +6.62% | -0.07% |
| XLRE | Real Estate | 41.61 | +1.96% | -4.15% | -5.92% | -2.62% | +3.12% |
| XLB | Materials | 49.43 | +1.17% | -3.81% | -1.65% | -4.34% | +9.00% |
| XLC | Communication Services | 110.38 | +0.05% | -0.41% | -0.12% | -3.40% | -6.24% |
| XLI | Industrial | 169.25 | -0.41% | -1.48% | -6.55% | -1.71% | +9.11% |
| XLK | Technology | 198.78 | -0.52% | +5.81% | +7.25% | +39.92% | +38.07% |
Sorted by Weighted Alpha (leaders → laggards) · Barchart, close of week.
The bottoms came in a sequence. The rate-sensitive sectors did not turn on the same day; they turned one after another over eight sessions, and the order is the read of the week:
- Utilities on 28 September — 39.25, now 41.41, +5.5% off the low and back above the 20-day average.
- Financials on 30 September — 53.40, now 54.73, +2.5%, every close since above it and Friday's the highest since 25 September; the fund sits exactly on its 20-day average.
- Staples on 1 October — 80.33, now 83.43, +3.9%, with a 2.1% jump on Thursday.
- Health care on 2 October — 166.18, a higher low than the 165.36 of 11 September, now 170.81, +2.8%, back above its 50-day average.
- Real estate on 7 October — 40.57, now 41.61, +2.6%.
Defensives first, then the financials, then property. That is the order a market moves in when it starts to price the end of a rate rise — and it started while the central bank was still talking about the next one.
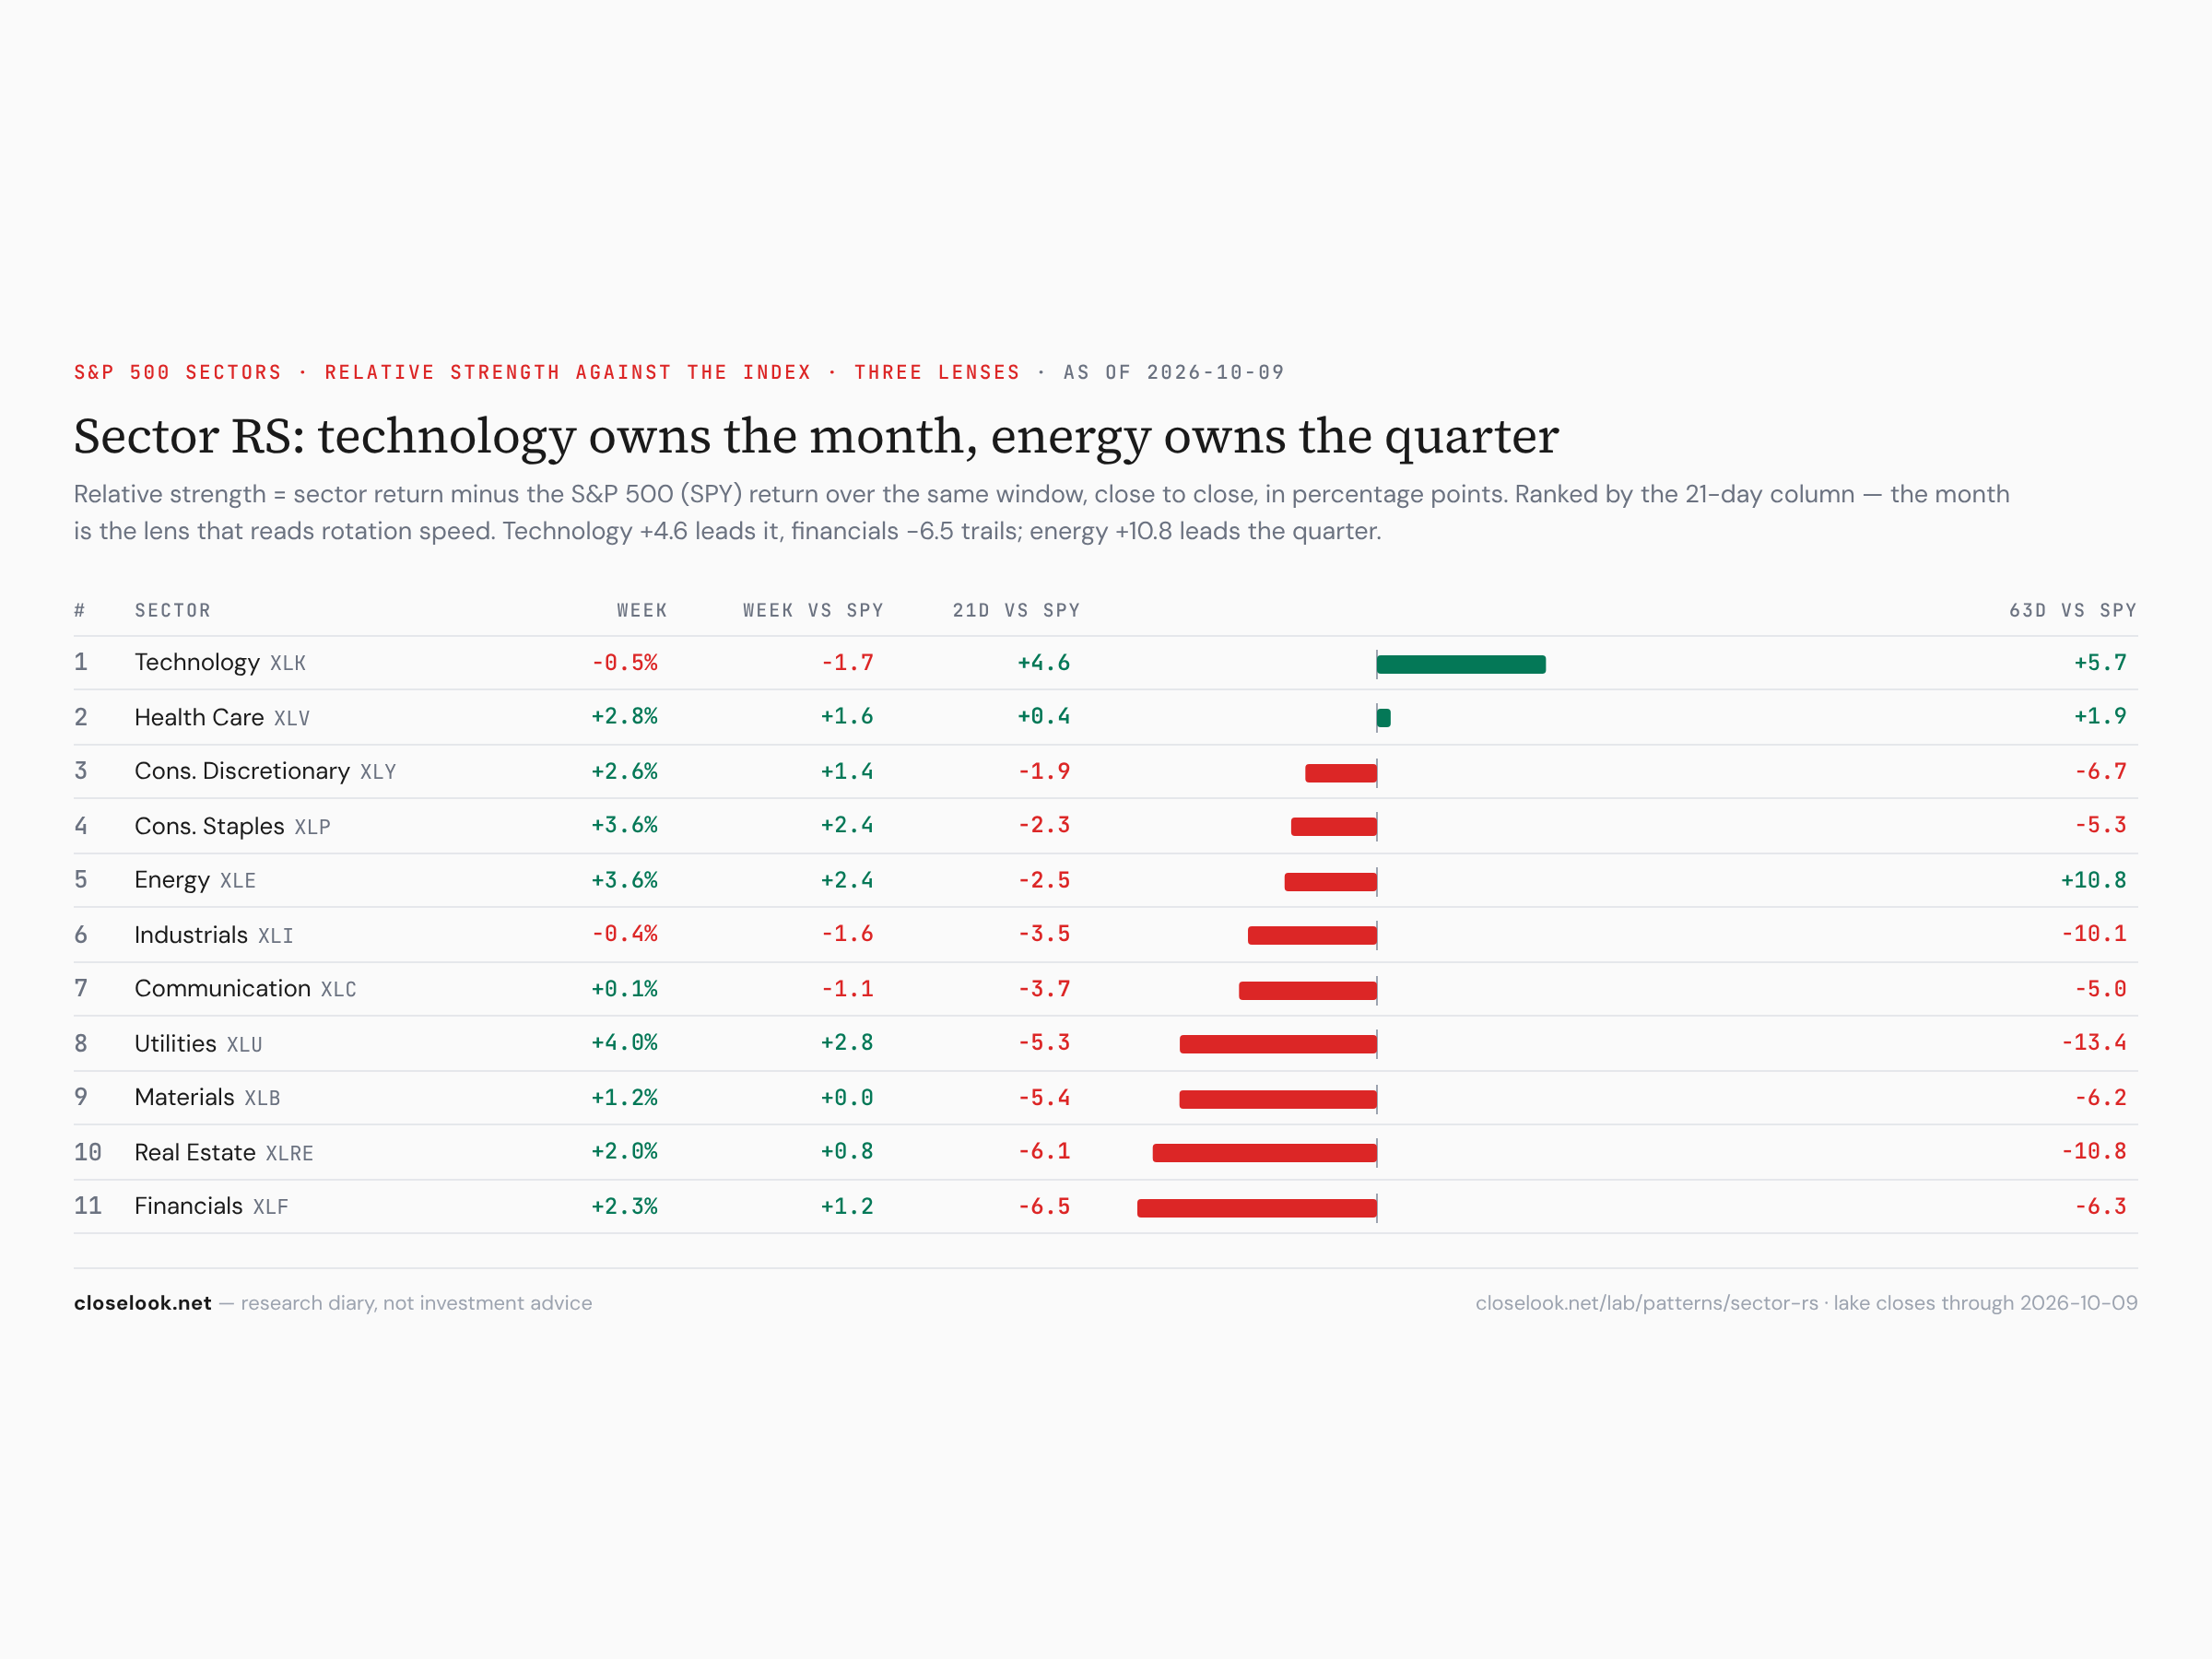
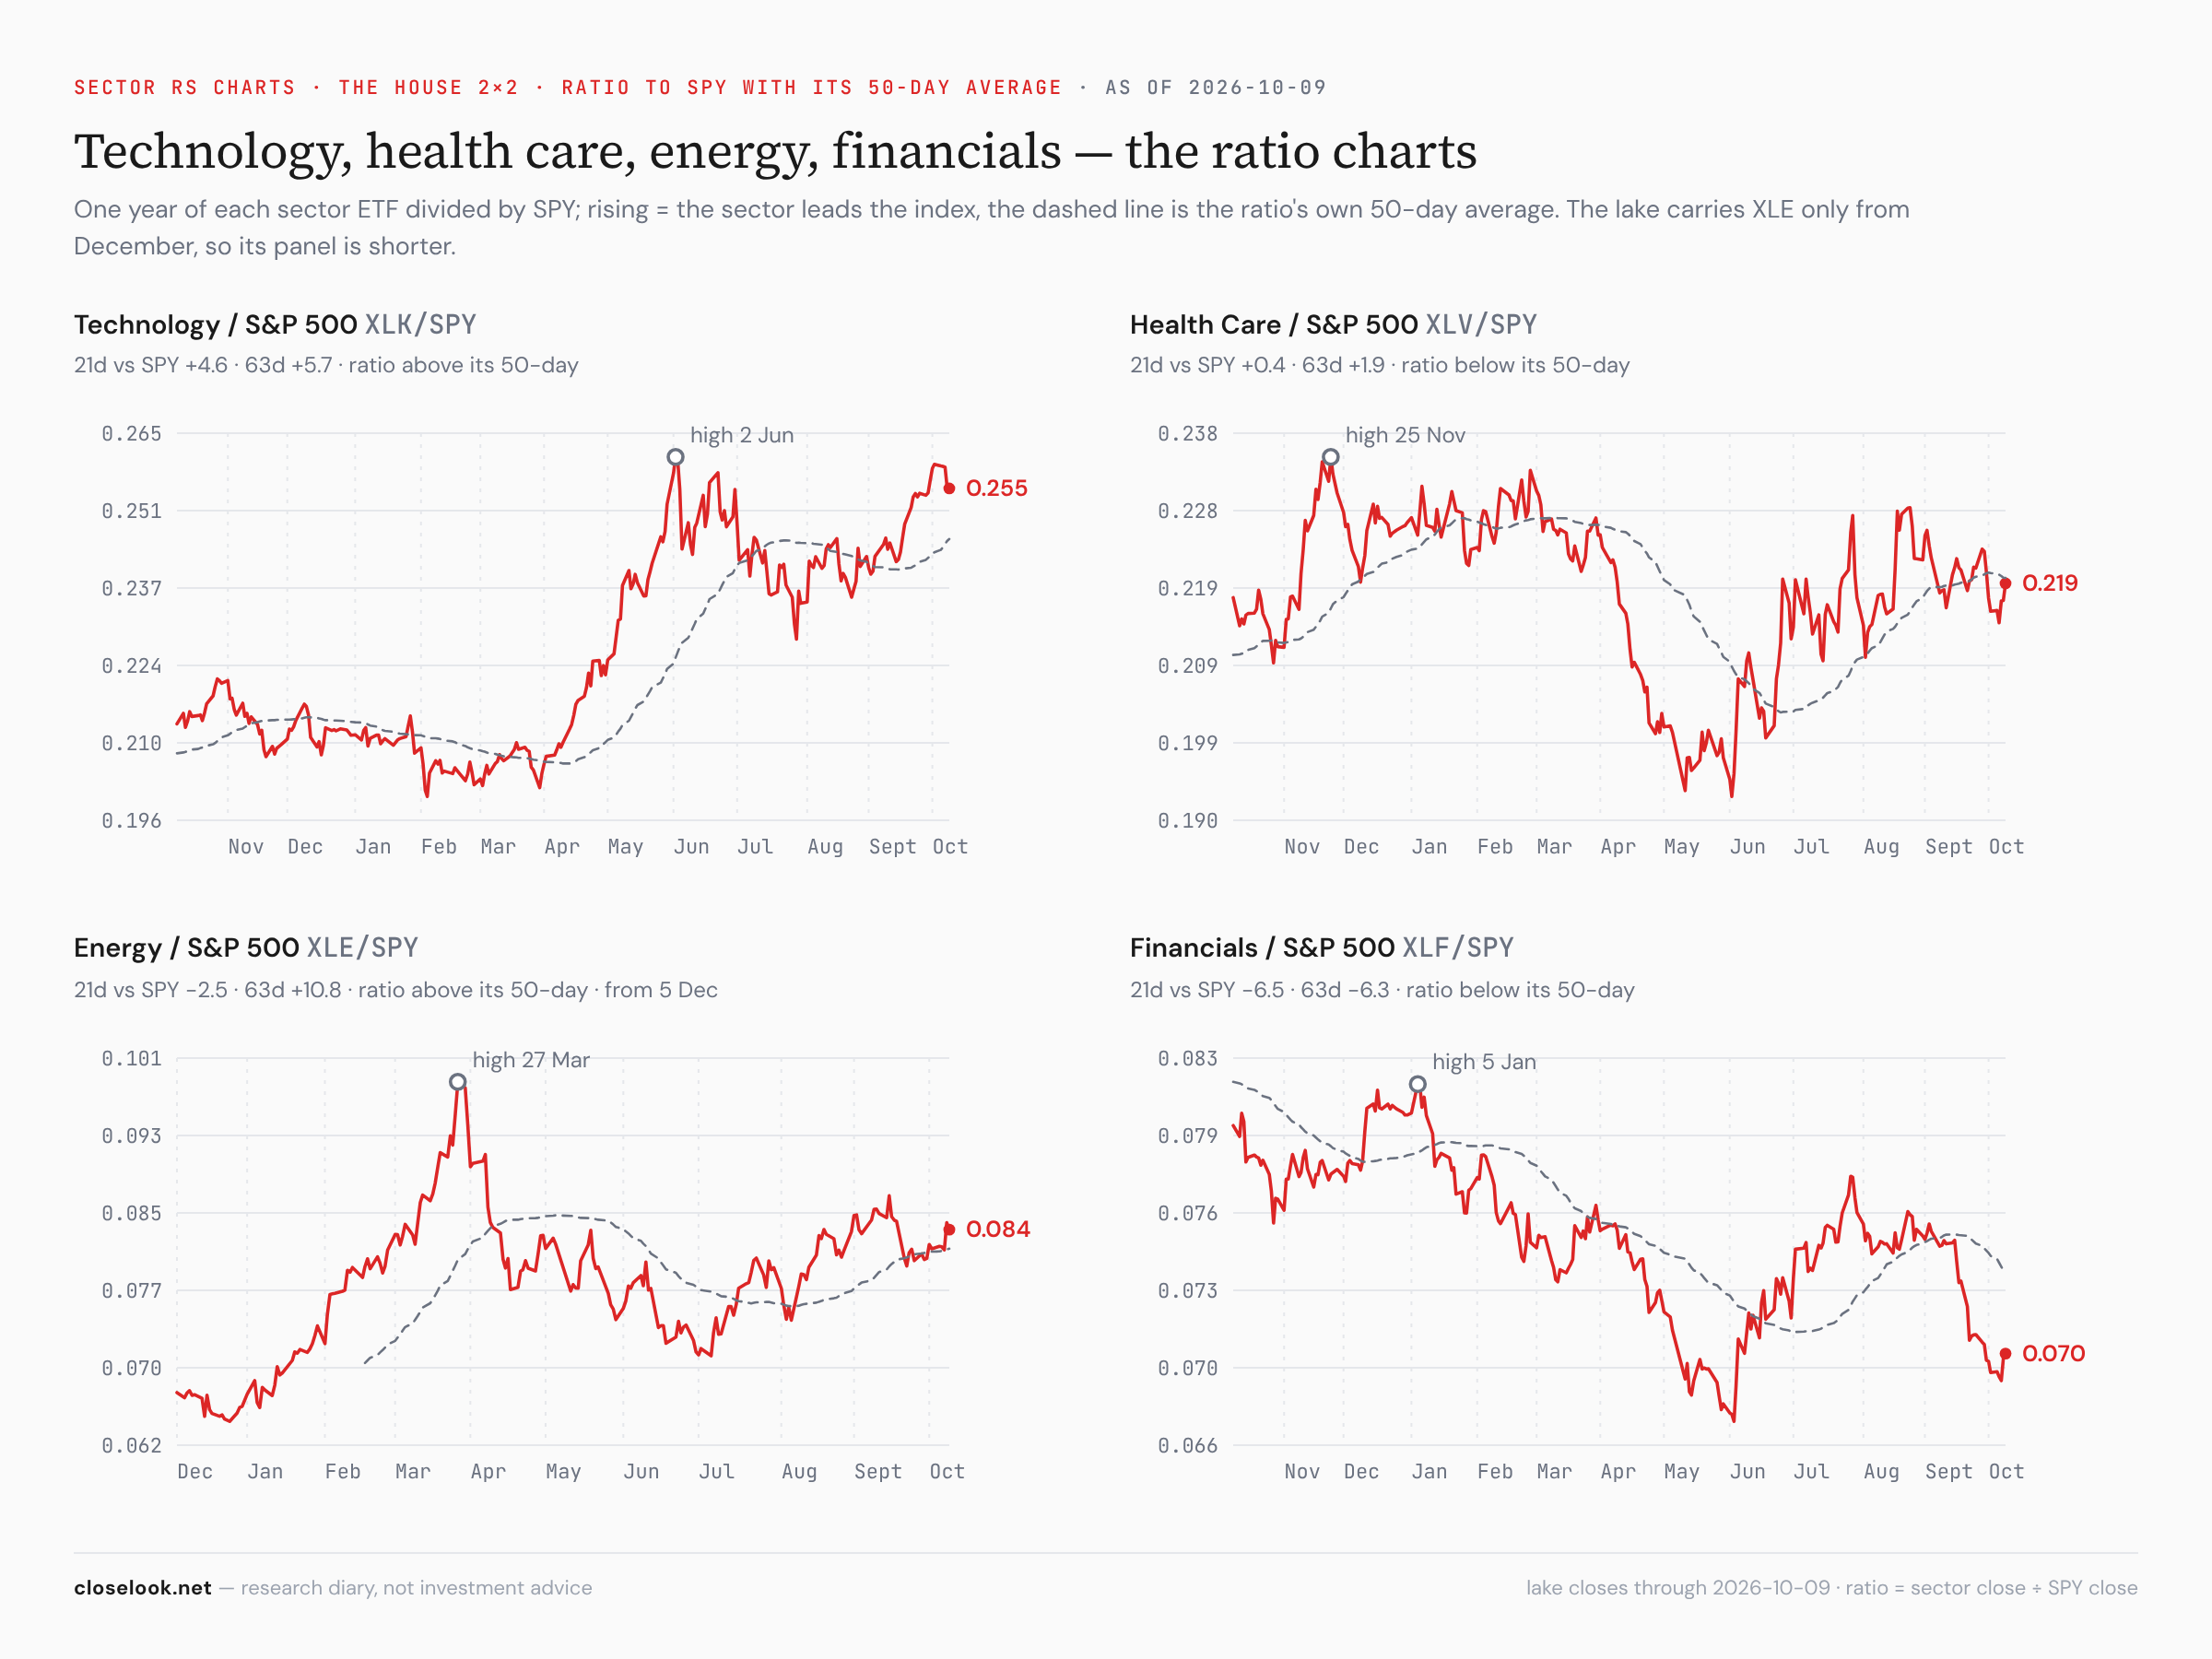
Consumer discretionary — the cap-weighted fund and the average. XLY rose 2.55% with Amazon +4.3% and Tesla +3.3% — but the move was not two names: the equal-weight discretionary fund rose 1.58% and the equal-weight retail fund 1.77%. XLY is still 9.4% under its January high and 1.4% under its 50-day. The one corner of the consumer that did not rise is the one most tied to mortgage rates (below).
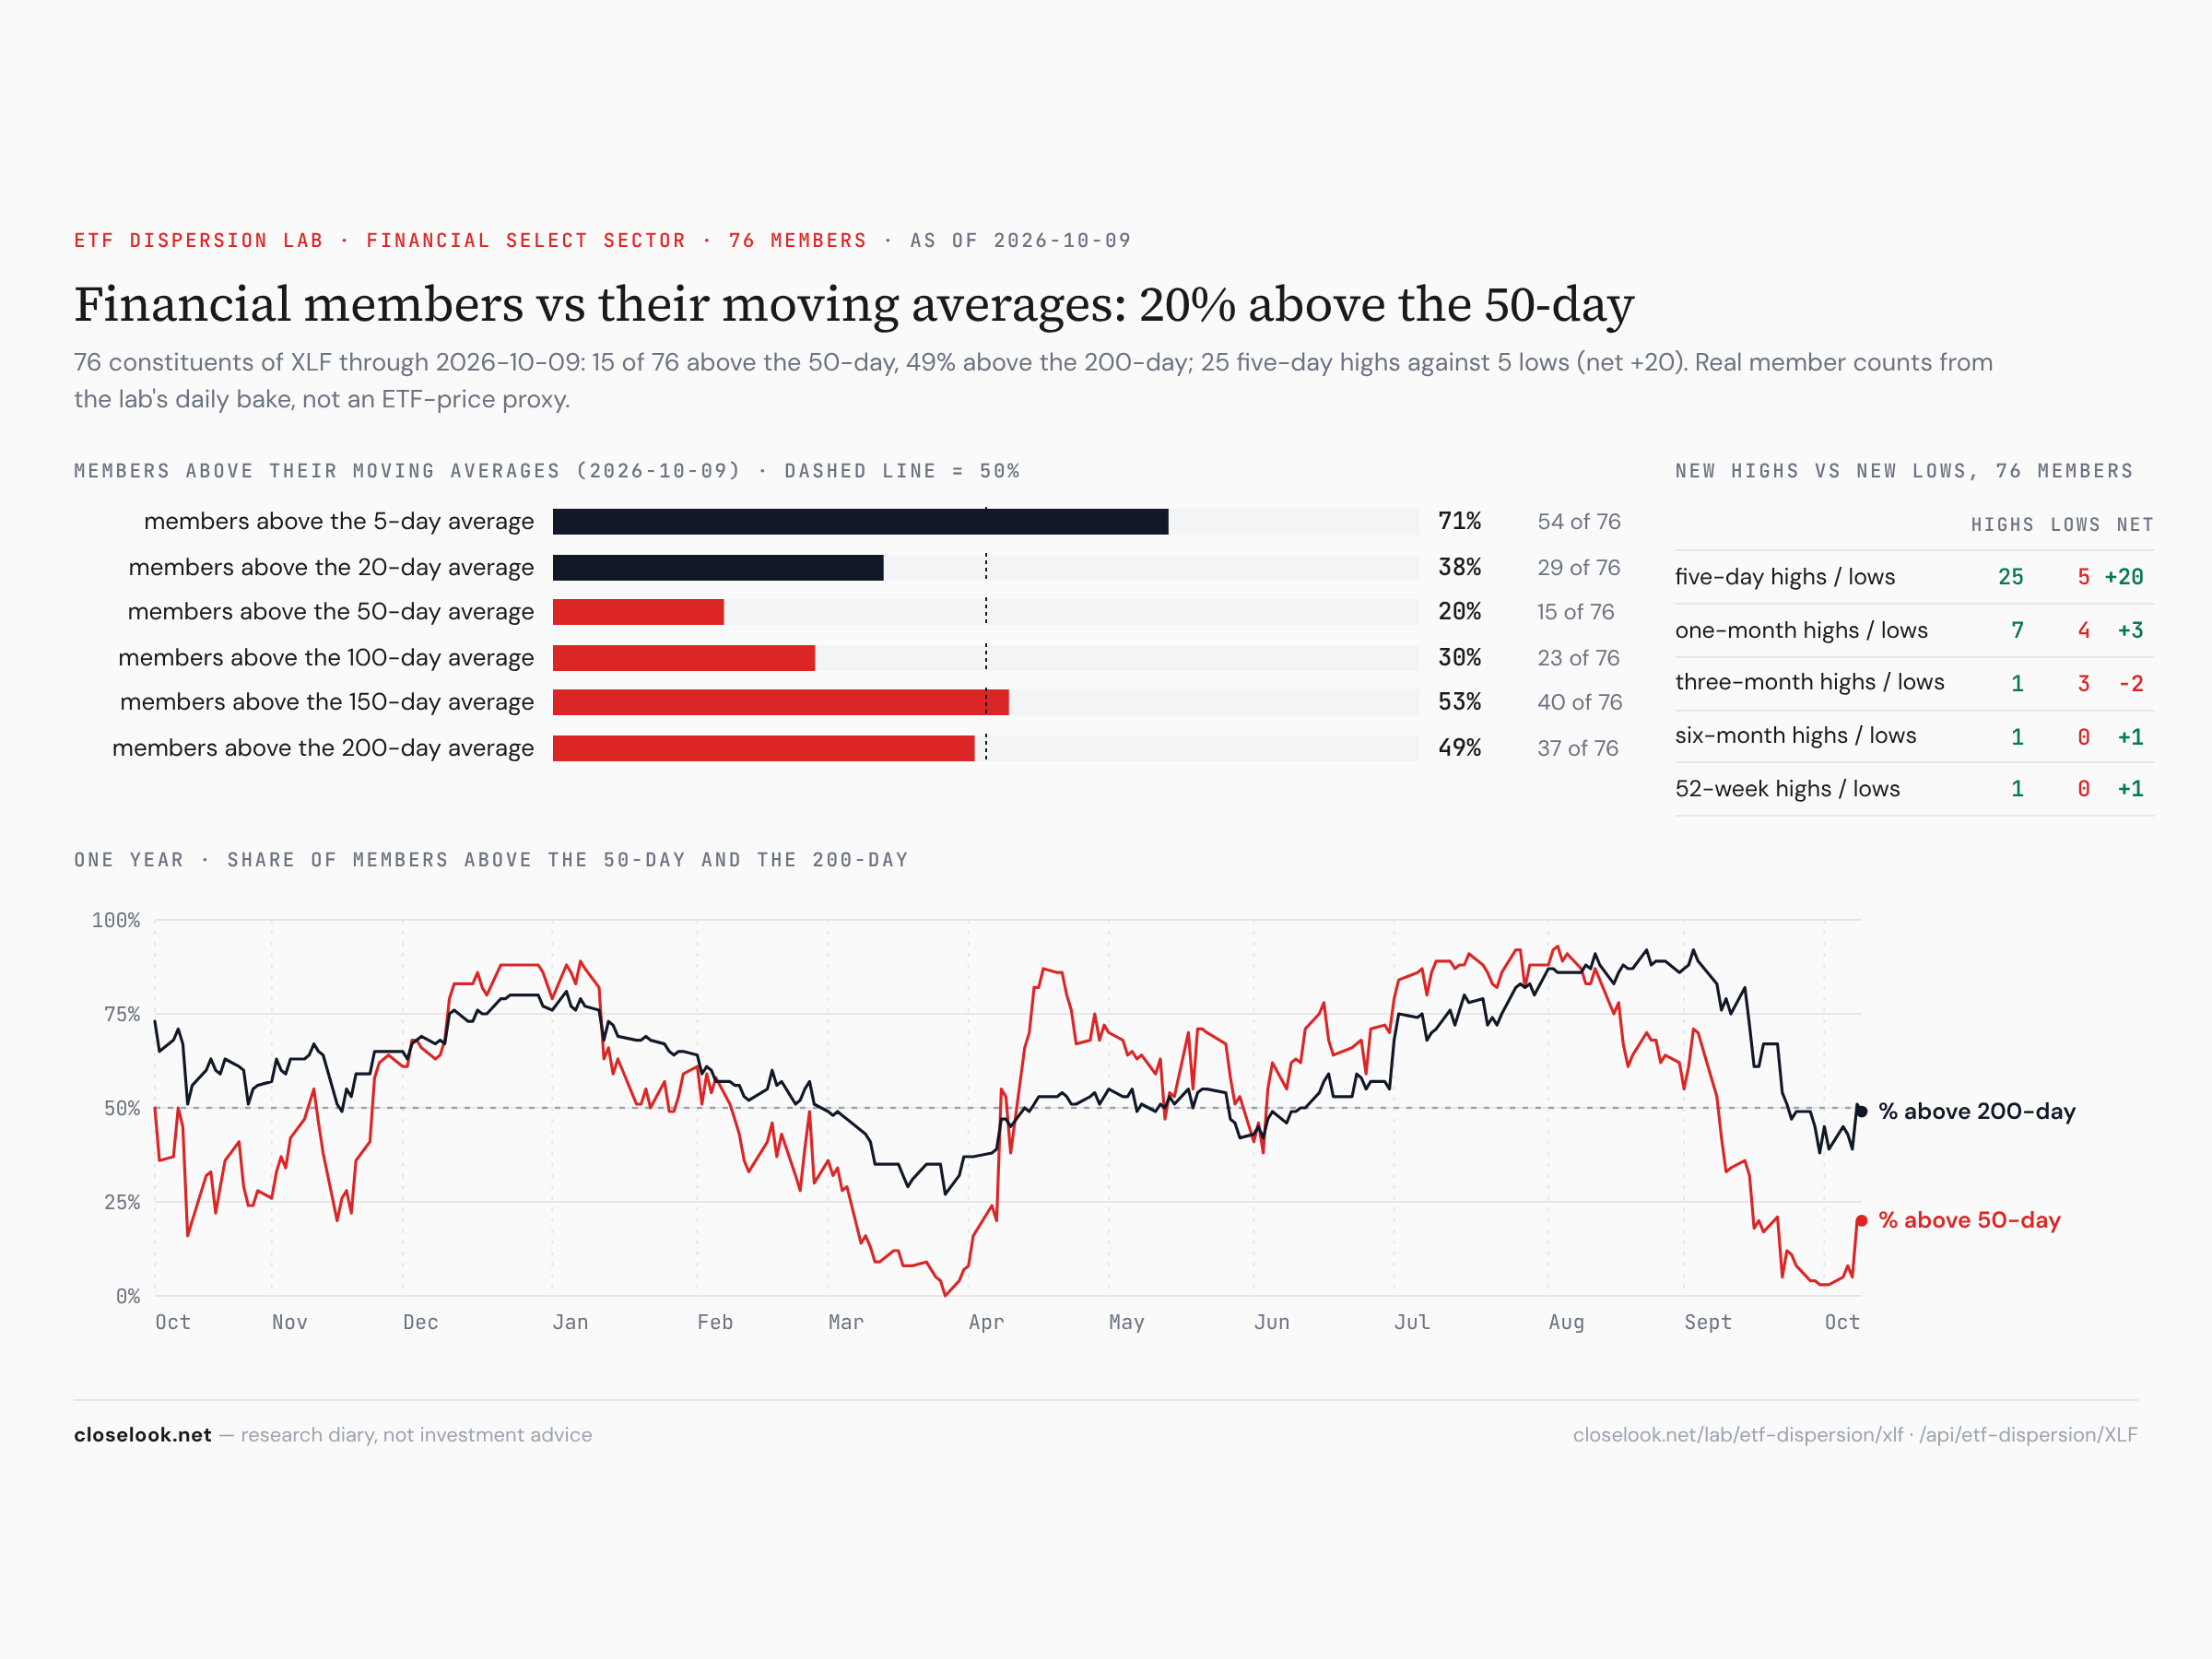
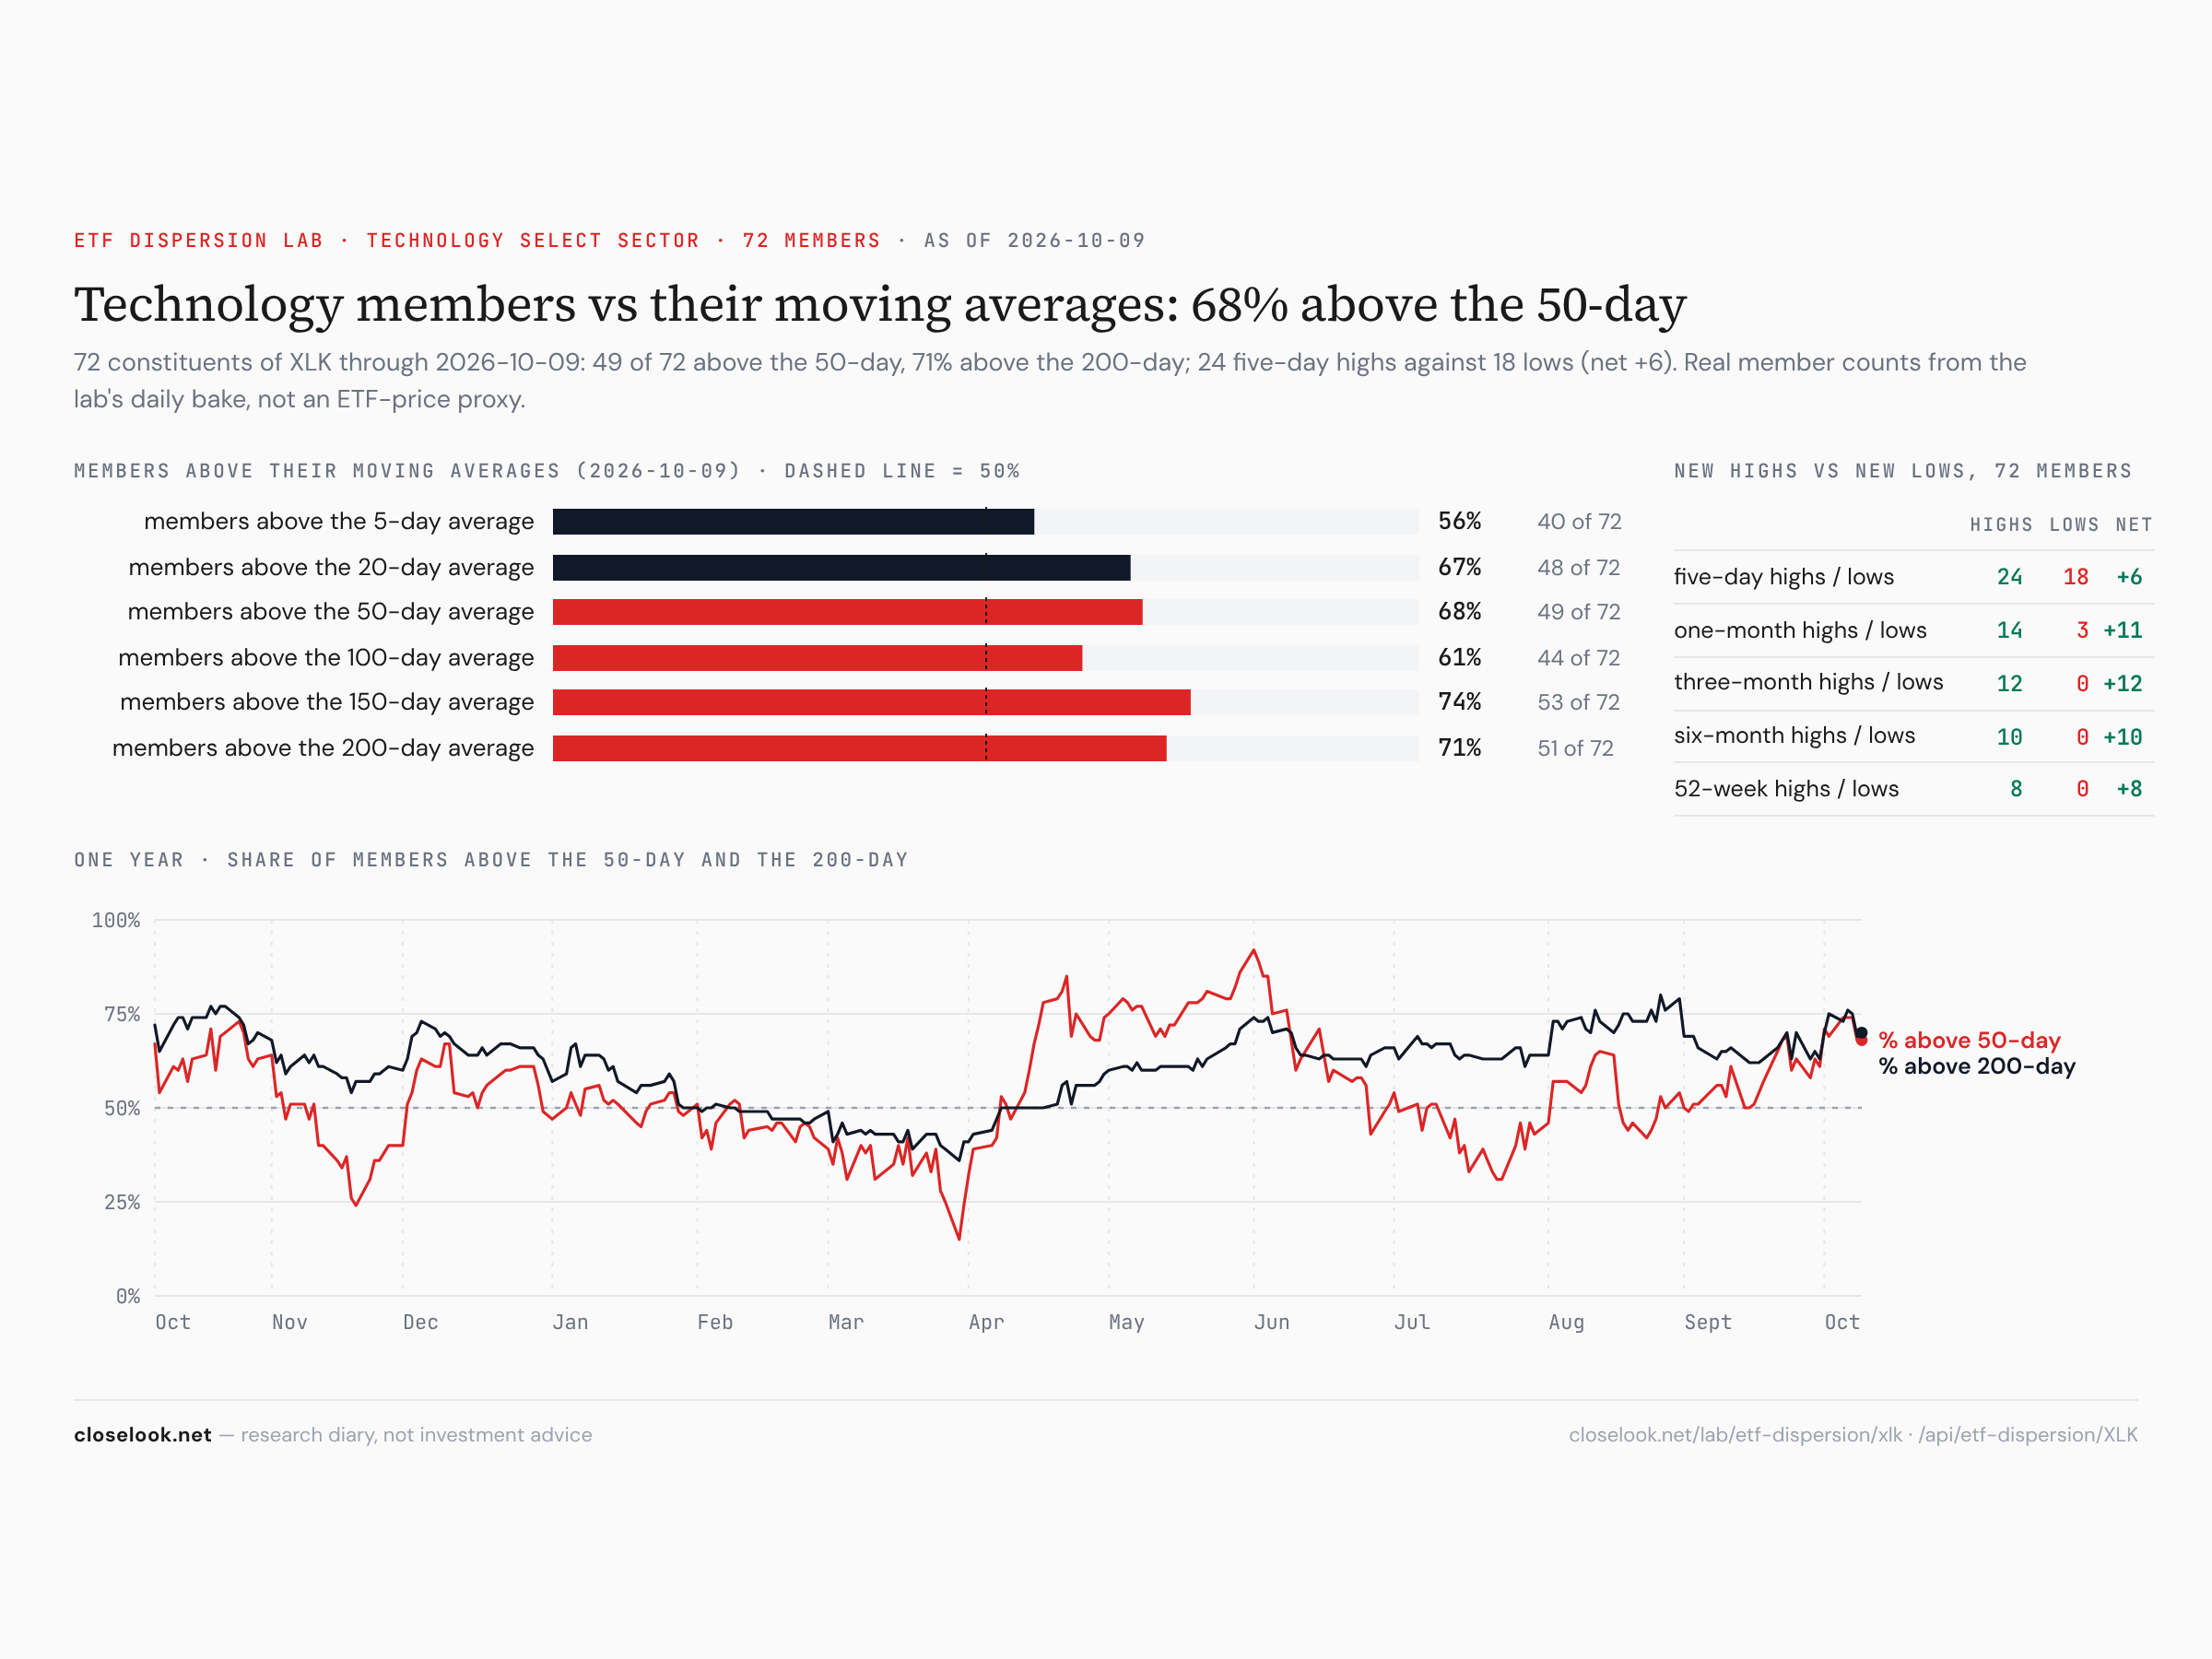
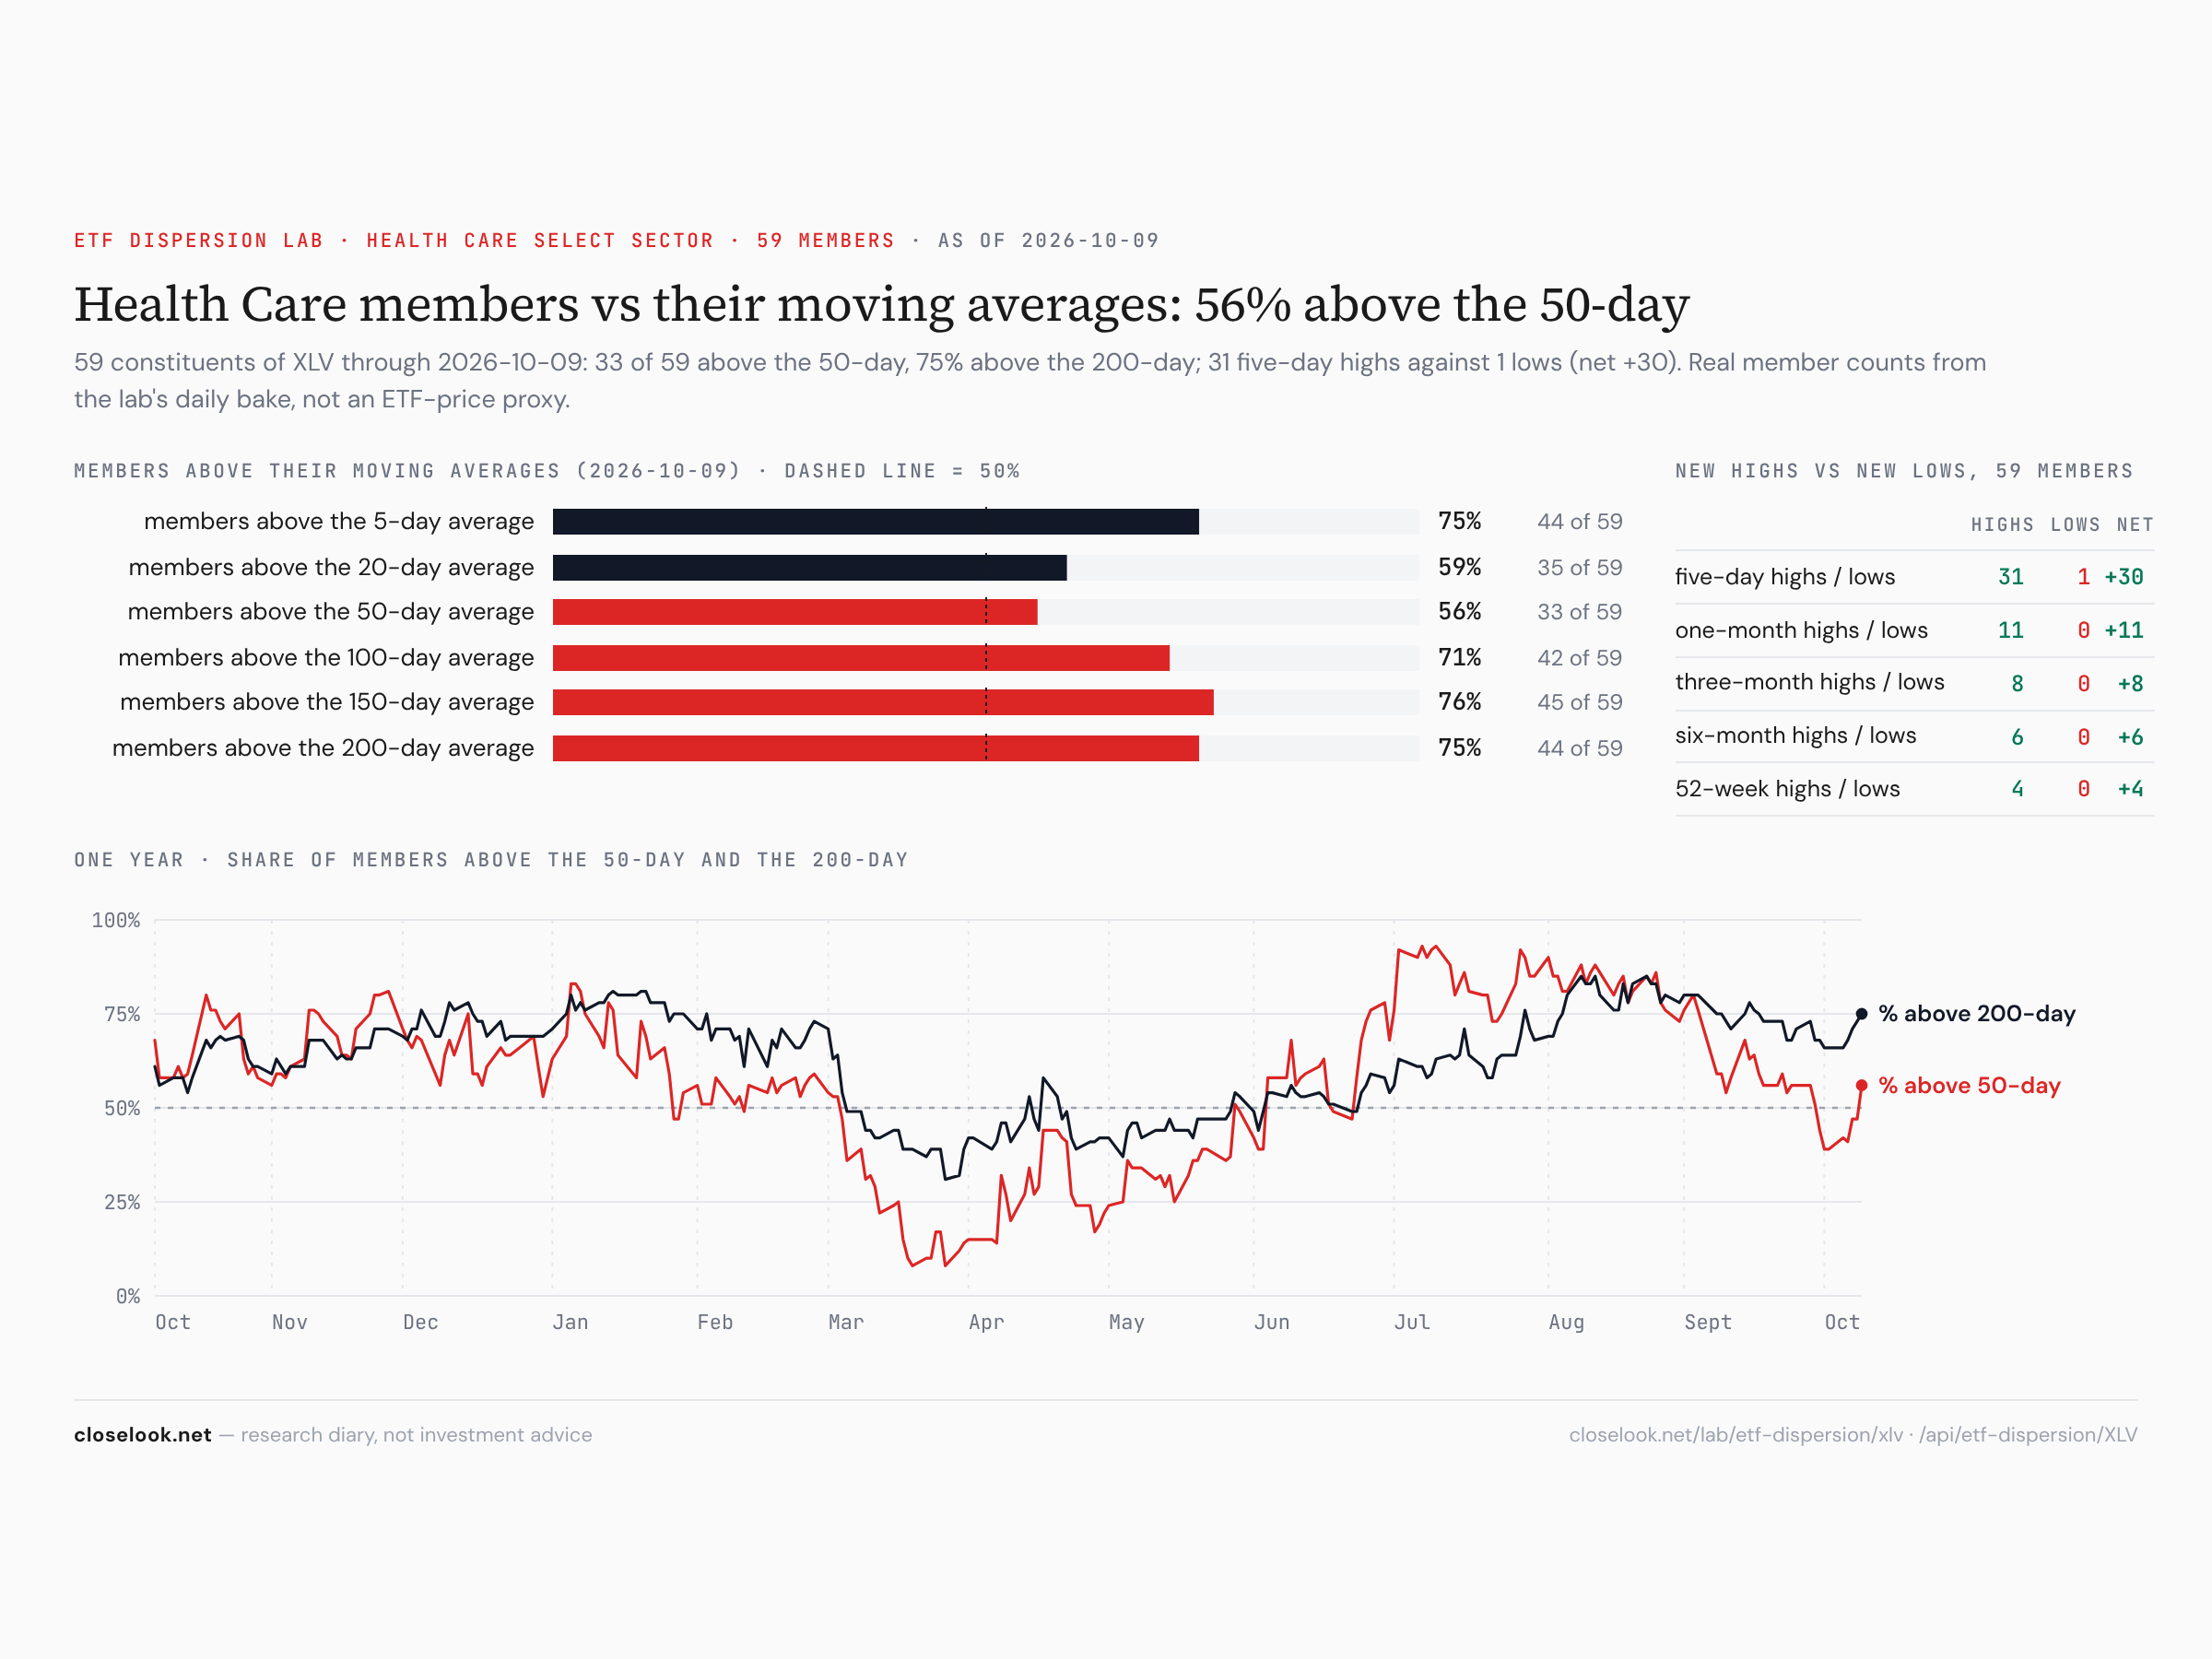
Breadth — the financials came back to life. A week ago not one of the 76 financial stocks in the S&P closed above its 20-day average. On Friday 29 did — 38% — and 71% were above their 5-day. Above the 50-day it is still only 20%: a turn, not yet a trend. In energy 20 of 21 members closed above their 5-day average; in health care 44 of 59. In technology 68% of members are above the 50-day — the sector that fell this week is still the one in the best shape underneath.
What has not joined yet. Three groups that usually lead a true rate peak fell this week:
- Homebuilders: ITB −2.17% to 84.76, XHB −2.00% — 25.4% and 21.9% under their February highs, 8.7% and 7.1% under their 50-day averages.
- Banks: the equal-weight bank fund −1.91%, regional banks −2.50% — both made their low close on 7 October and sit on it; brokers rose 1.48%.
- Small caps: −0.92%, 4.3% under the 50-day.
The money bought the large, the defensive and the cash-rich. It did not yet buy what depends on a cheaper mortgage or a cheaper loan. That gap is the measure of how much of the peak the market believes.
The Nasdaq 100, cut six ways
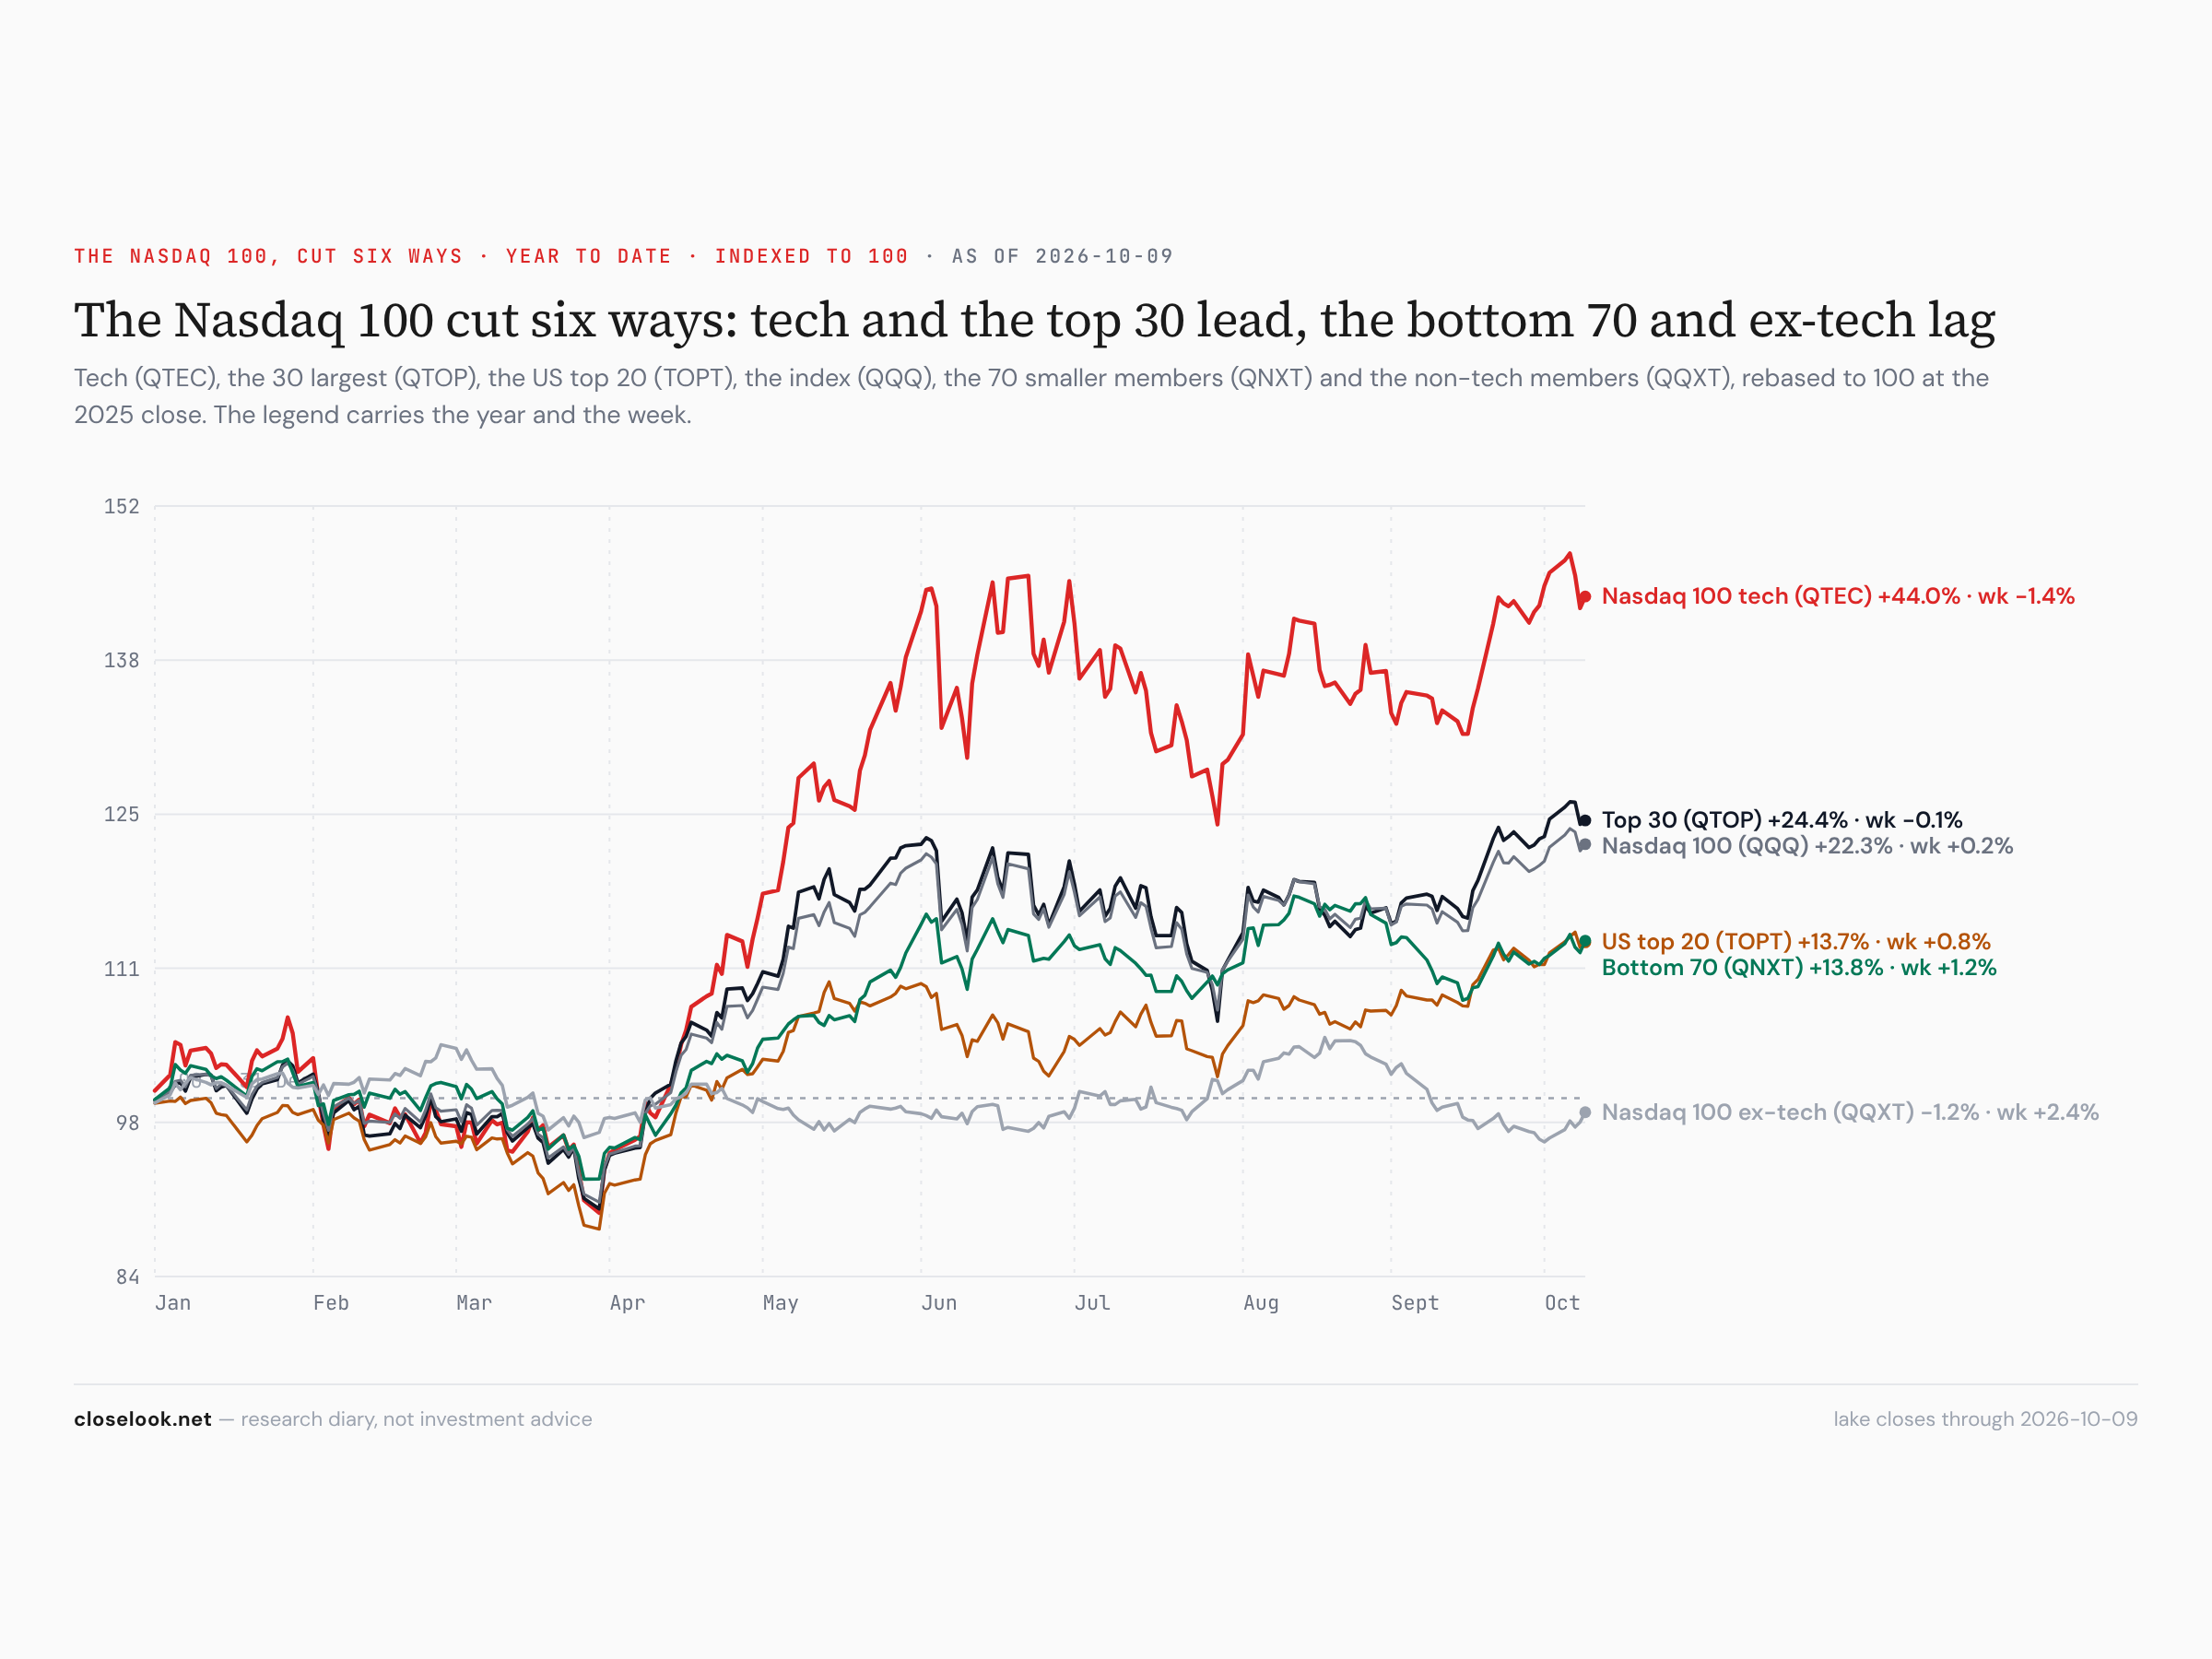
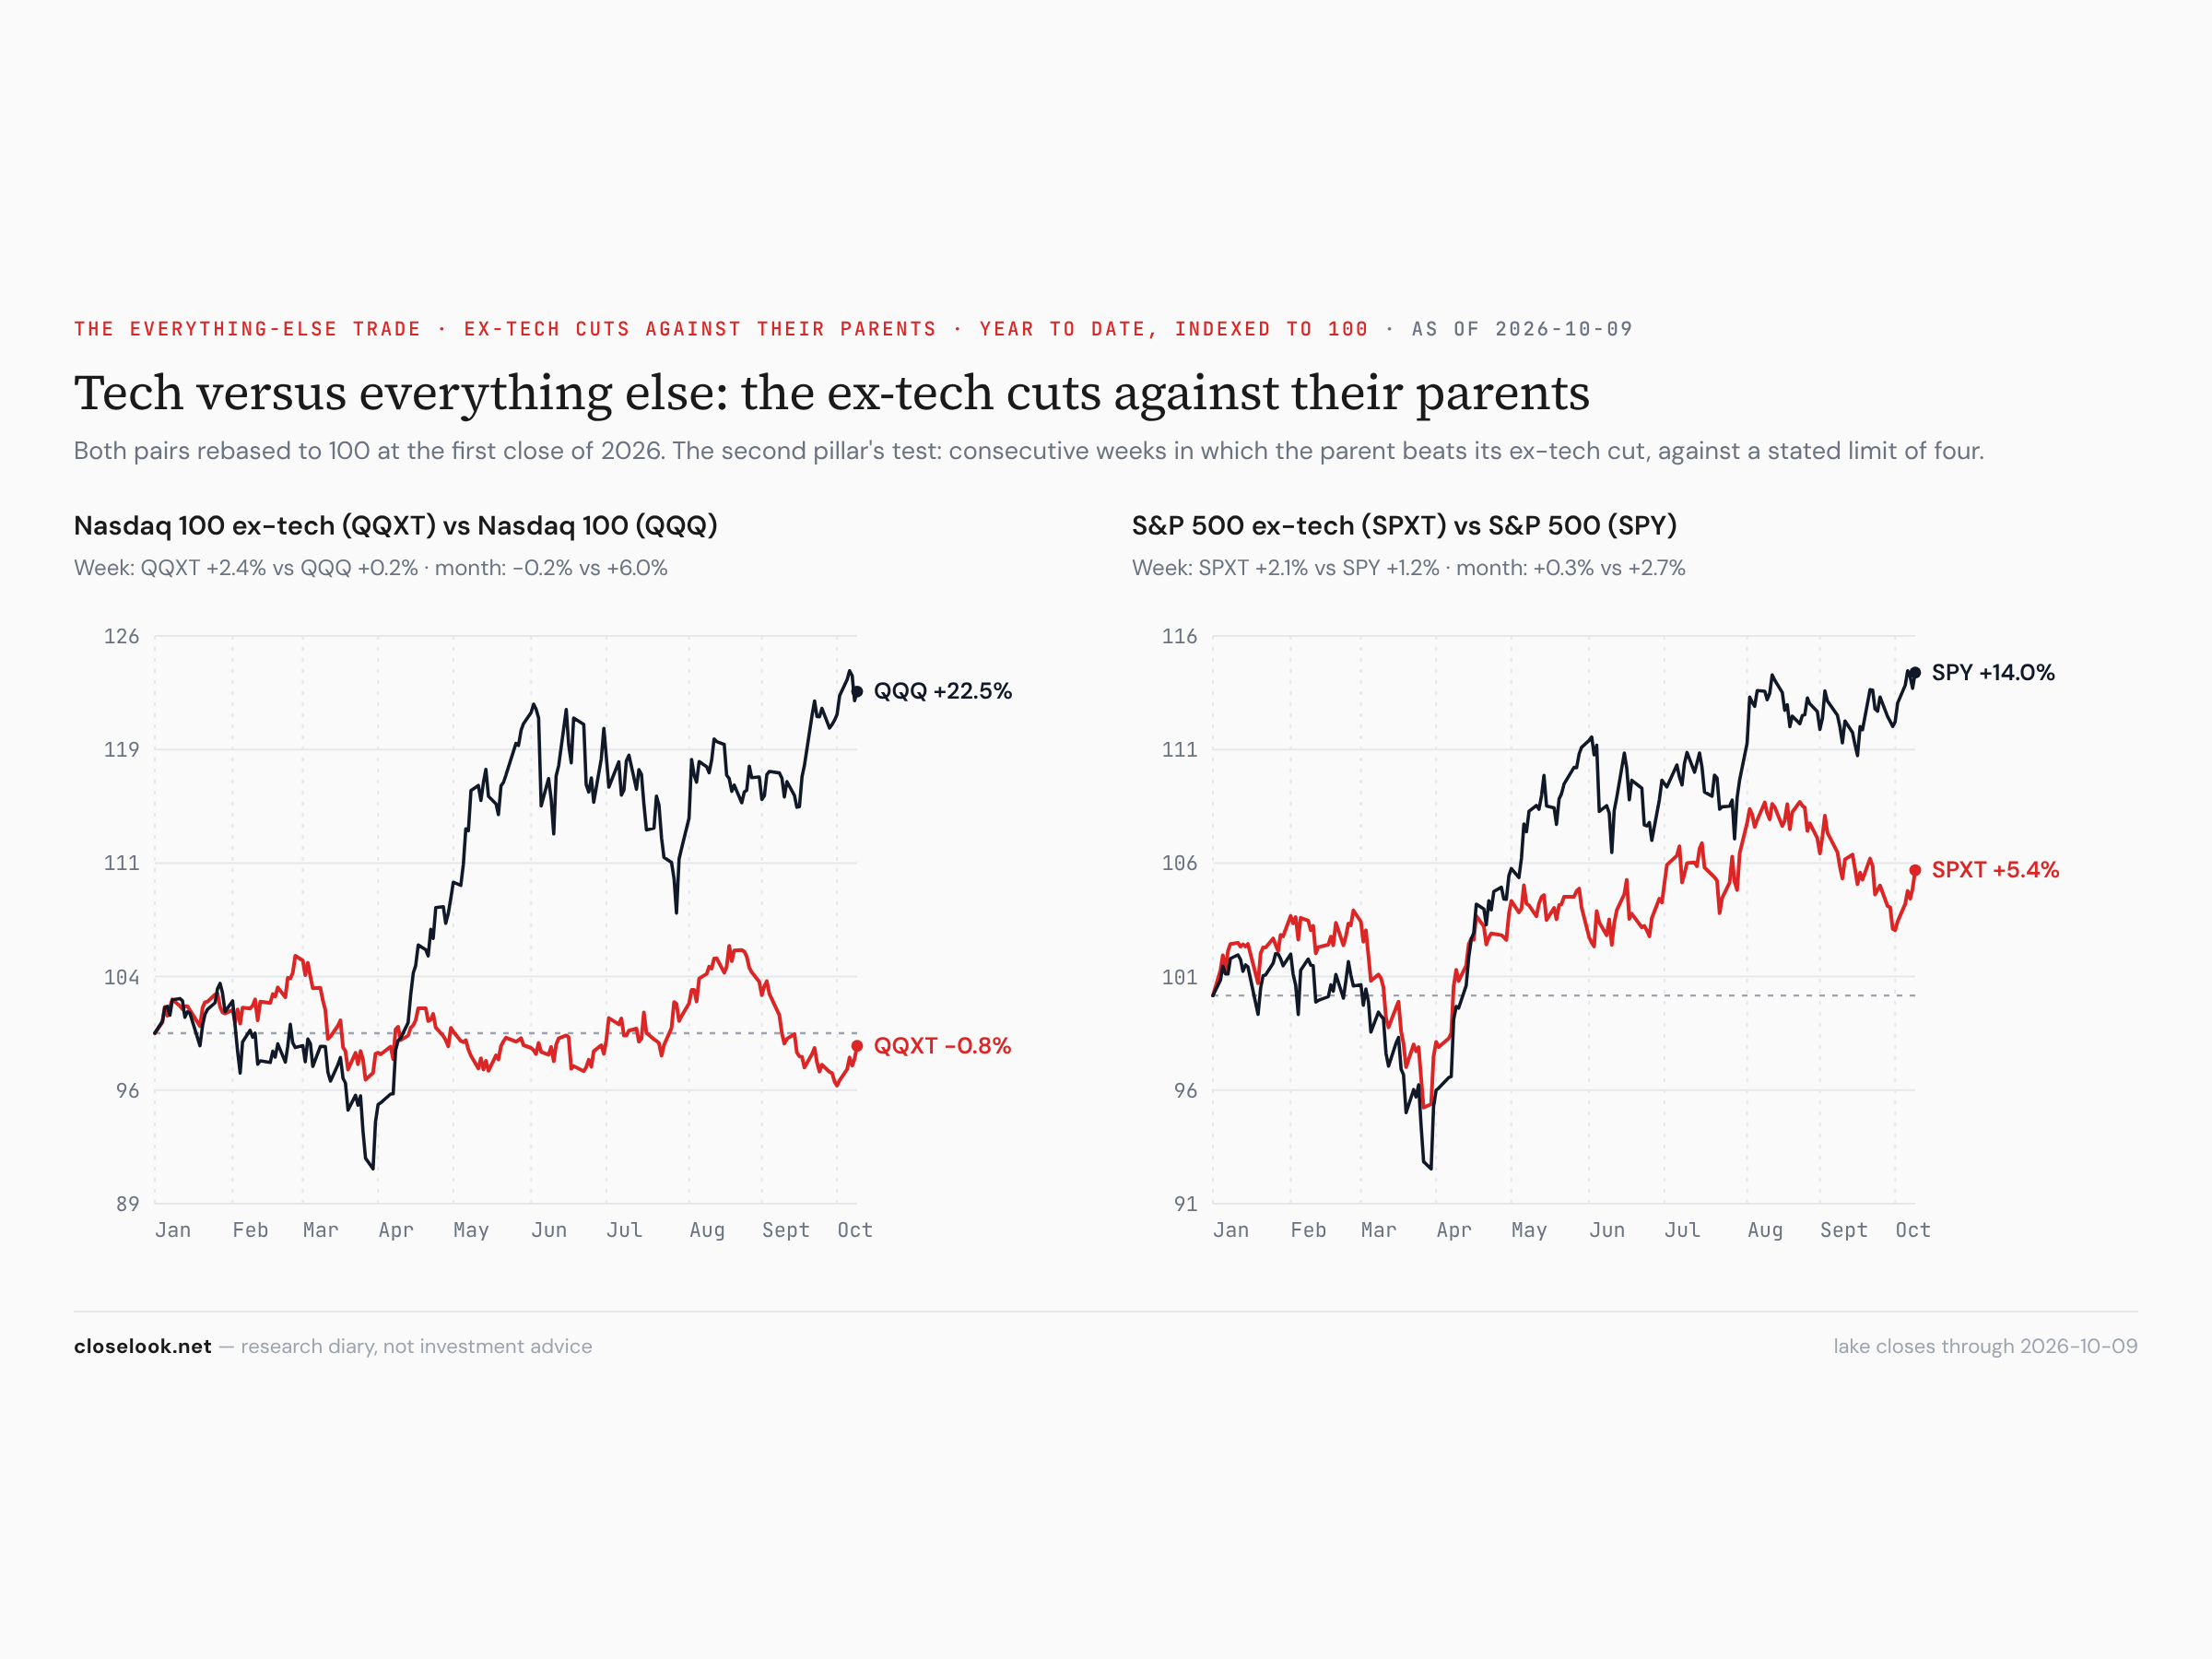
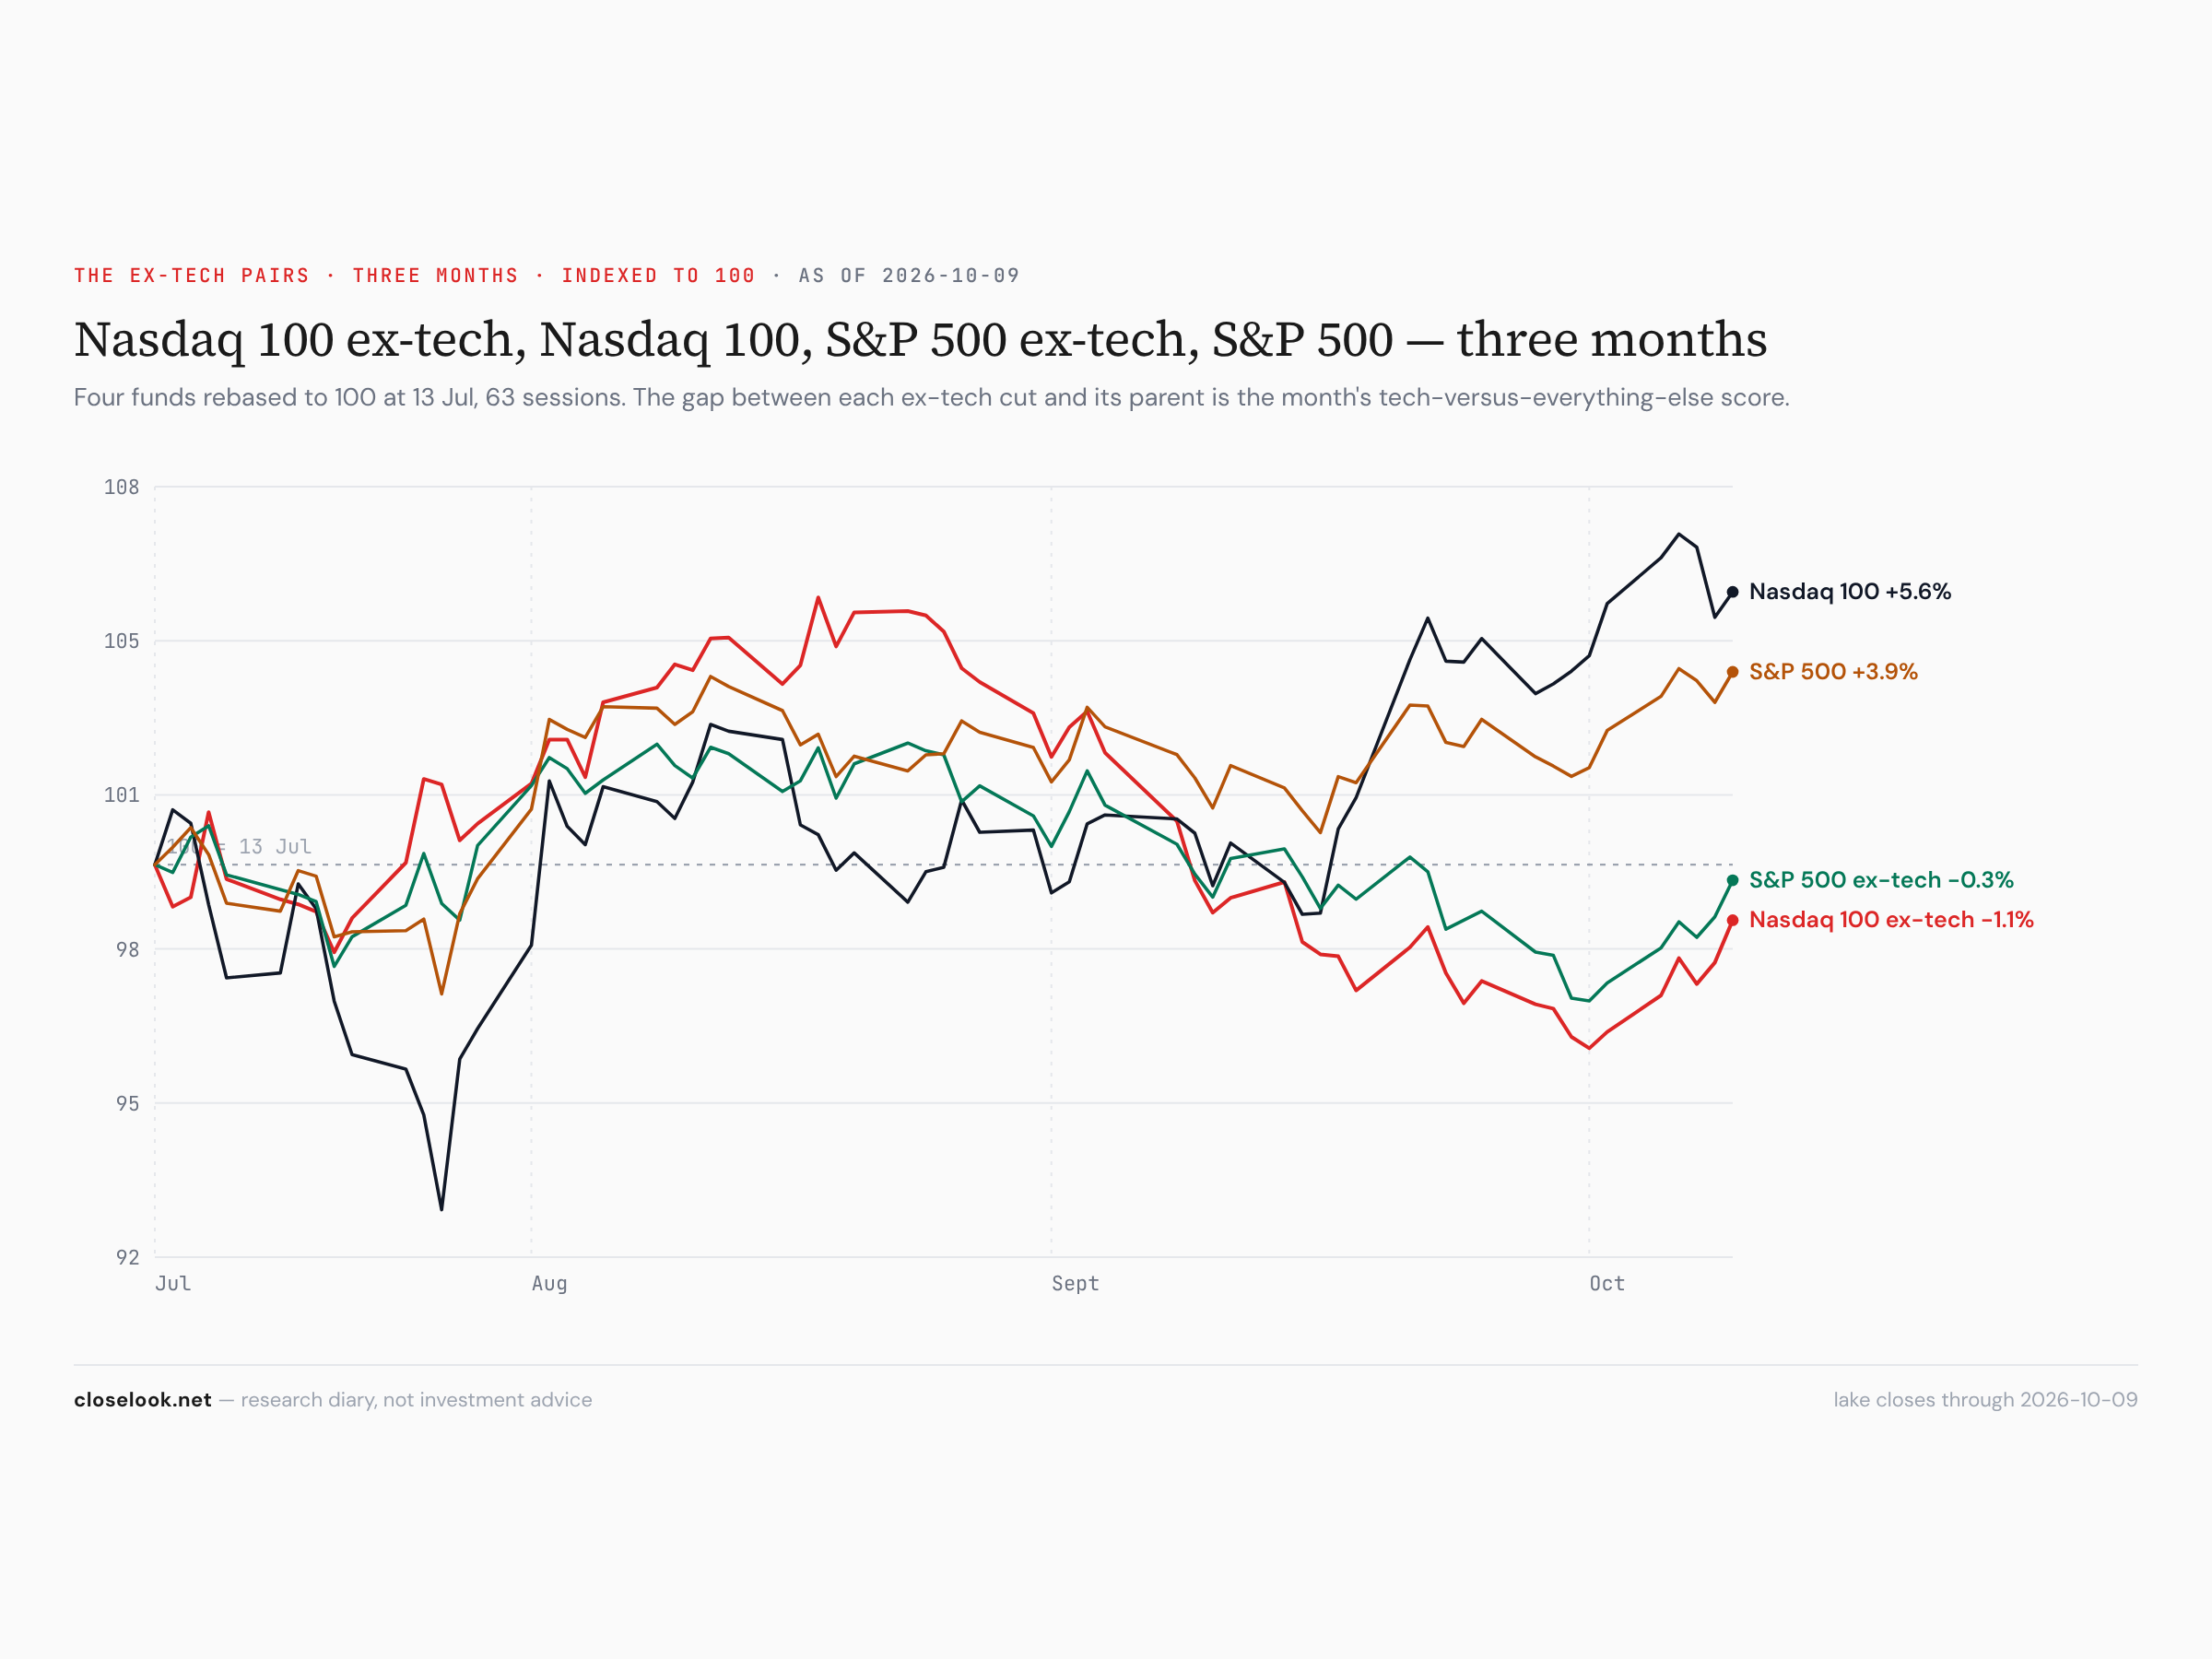
The week: the Nasdaq 100 without tech +2.35%, the S&P 500 without tech +2.14%, the S&P +1.16%, the S&P 500 without the Magnificent Seven +1.05%, the Nasdaq 100 +0.23%, the Nasdaq 100 tech sector −1.42%. On the year the order is unchanged: Nasdaq tech +44.0%, the Nasdaq 100 +22.3%, the S&P +14.2%, the S&P without tech +5.6%, the Nasdaq without tech −1.2%. One week does not undo a year; it does show where the next dollar went.
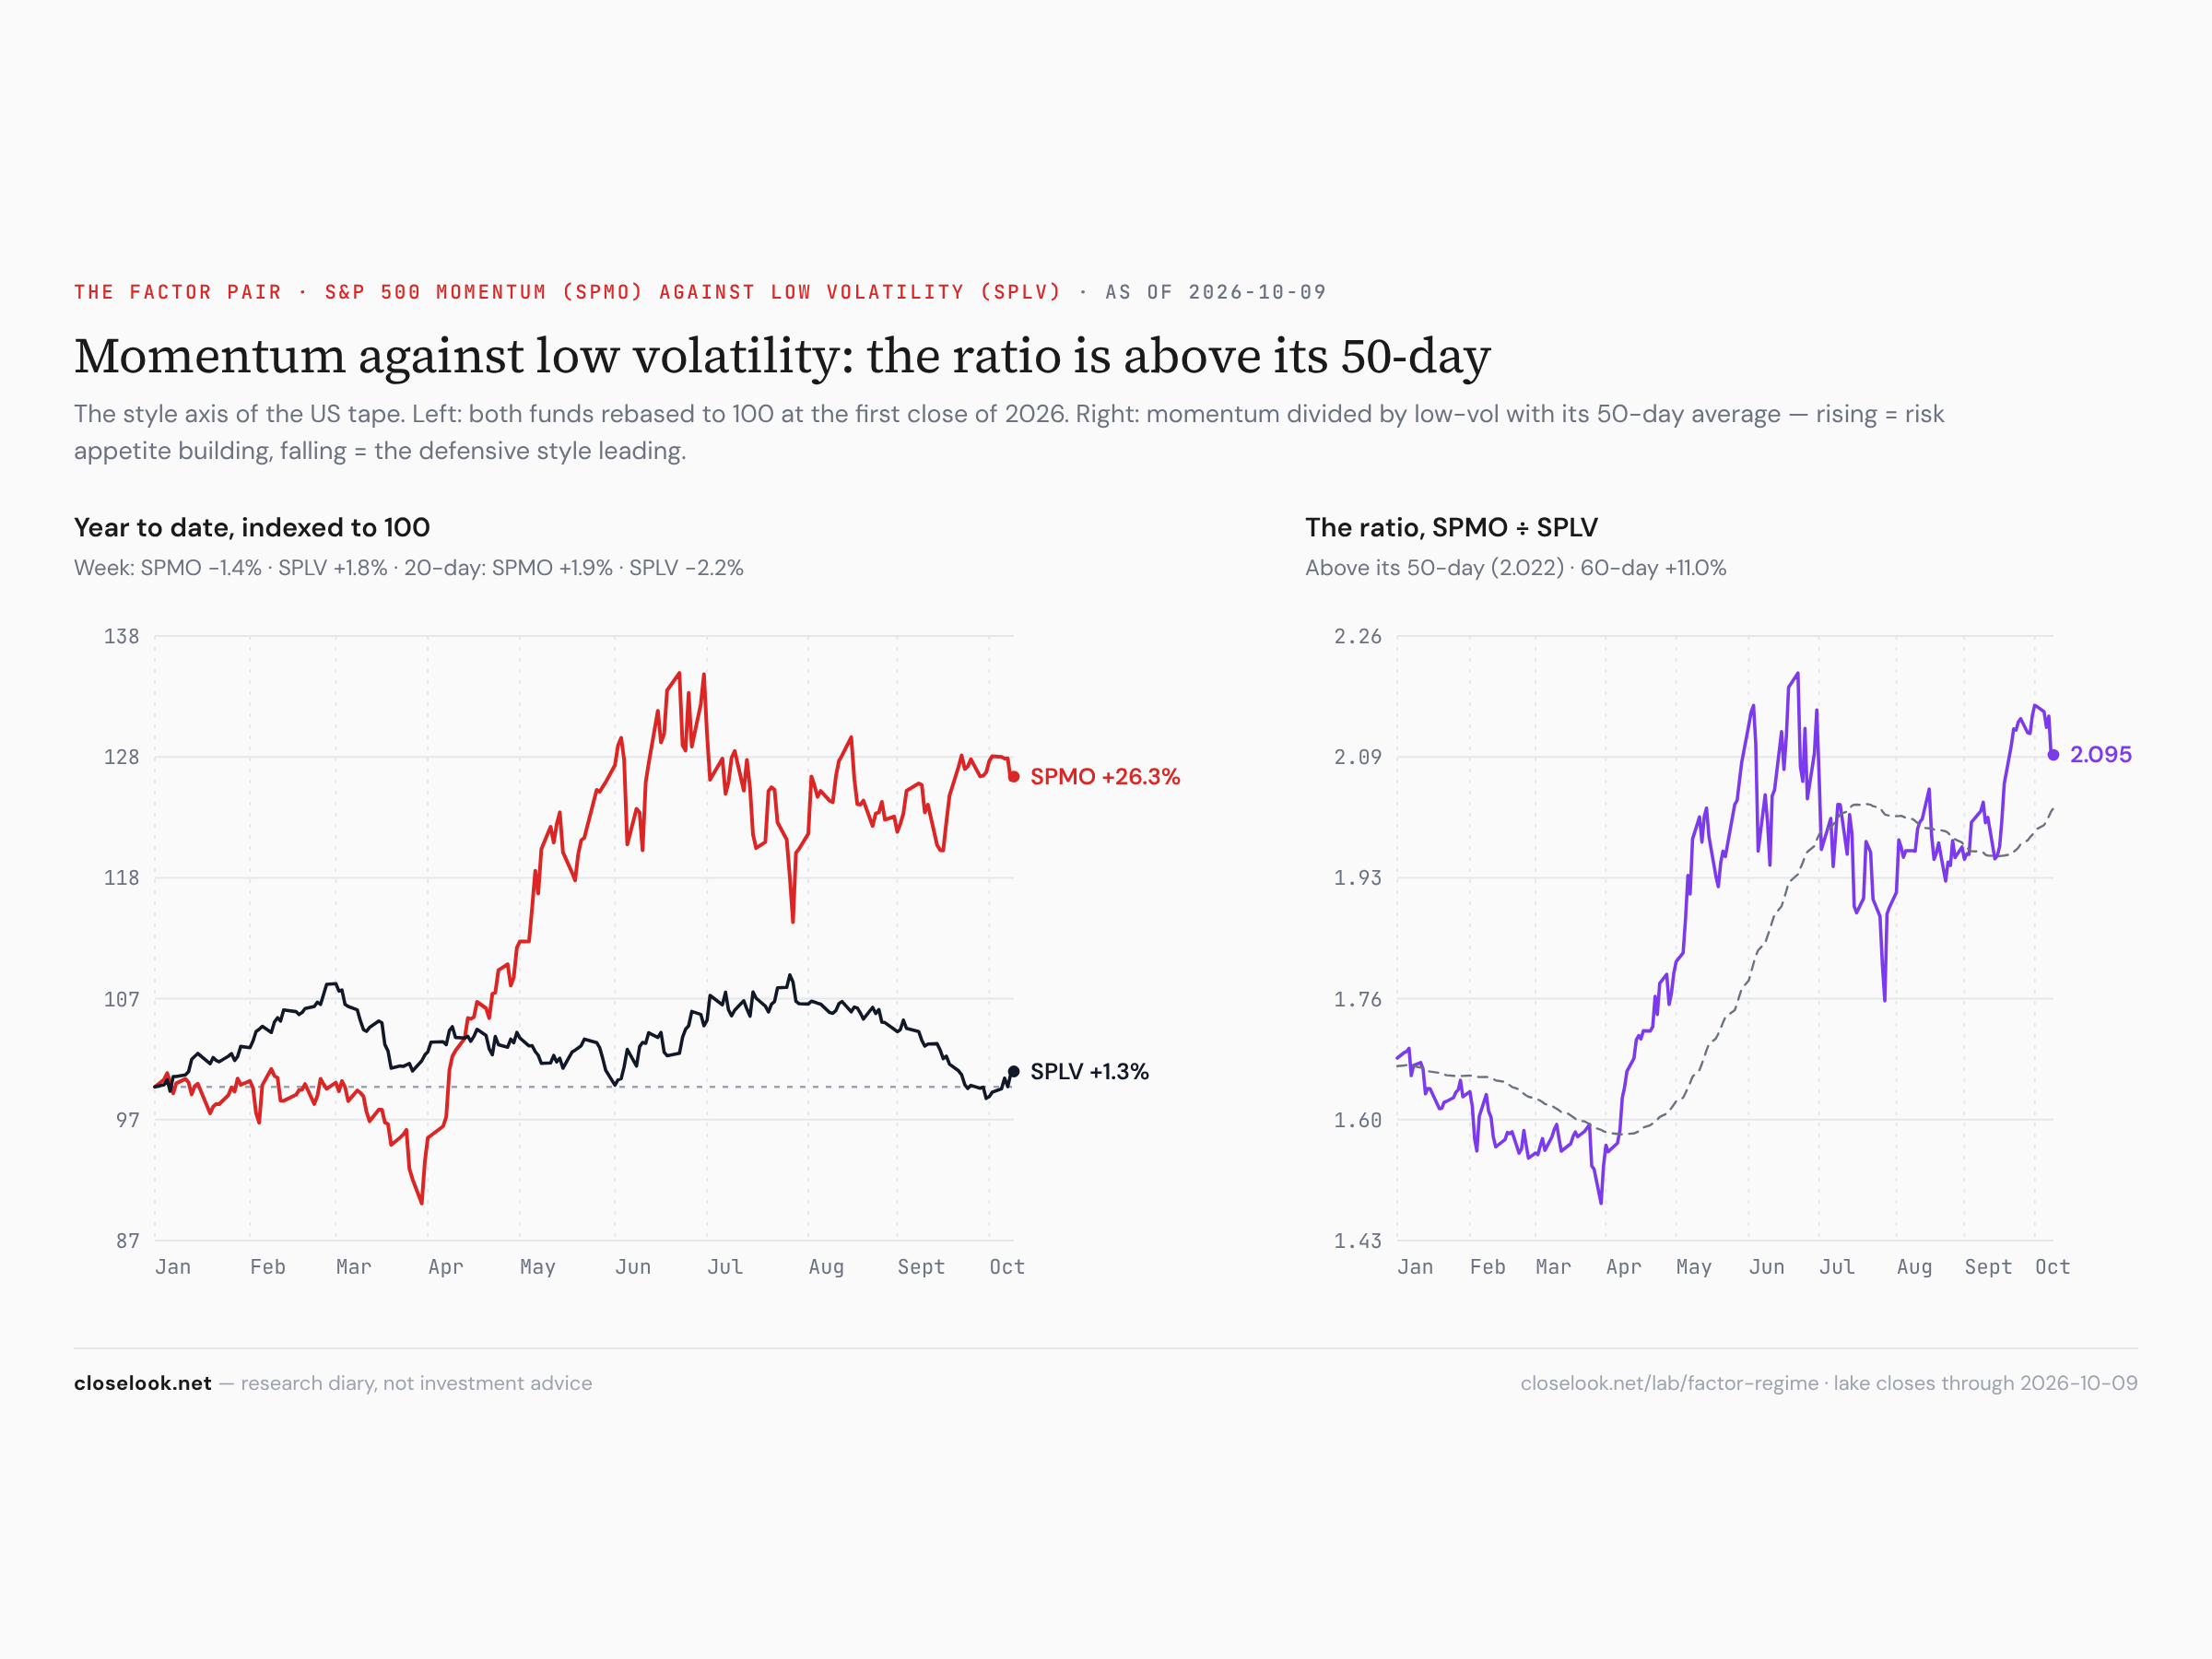
Momentum against low volatility. Momentum fell 1.35%, low volatility rose 1.76%. The momentum/low-vol ratio fell 3.1% on the week — still above its 50-day and still in the 96th percentile of its range. The defensive end was paid; the aggressive end gave back a little of a very long lead.
The tech ETFs we carry
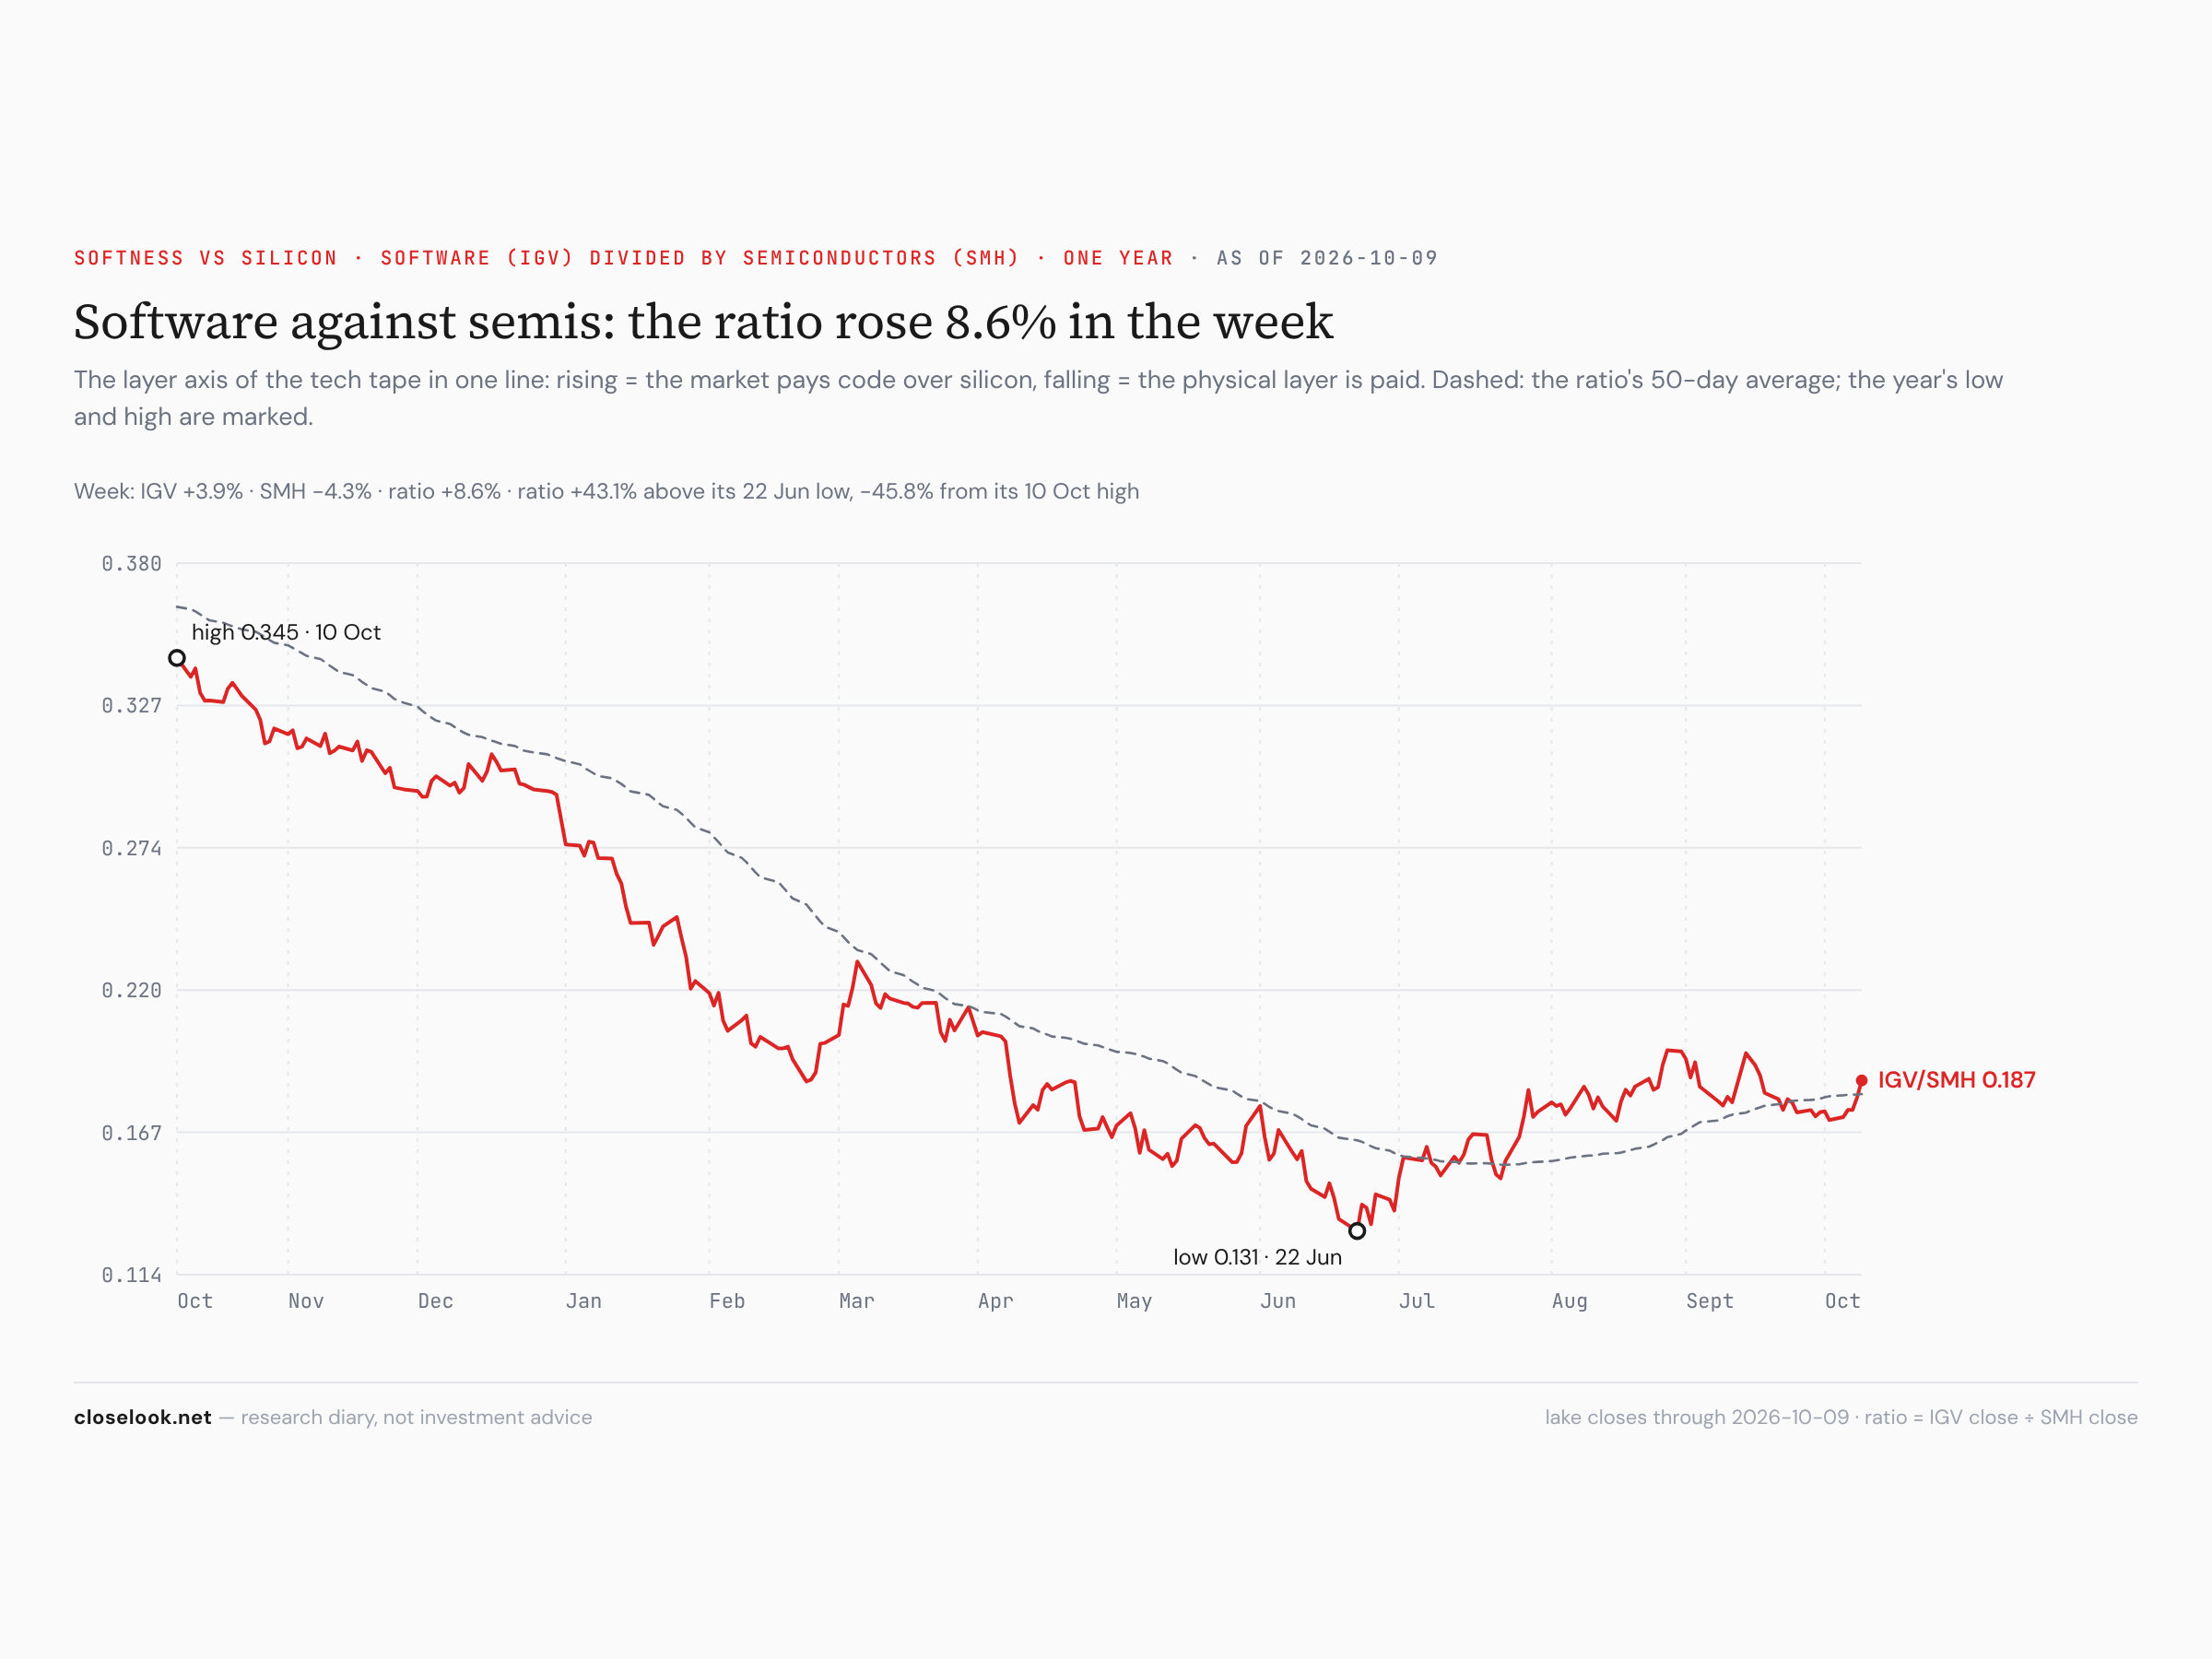
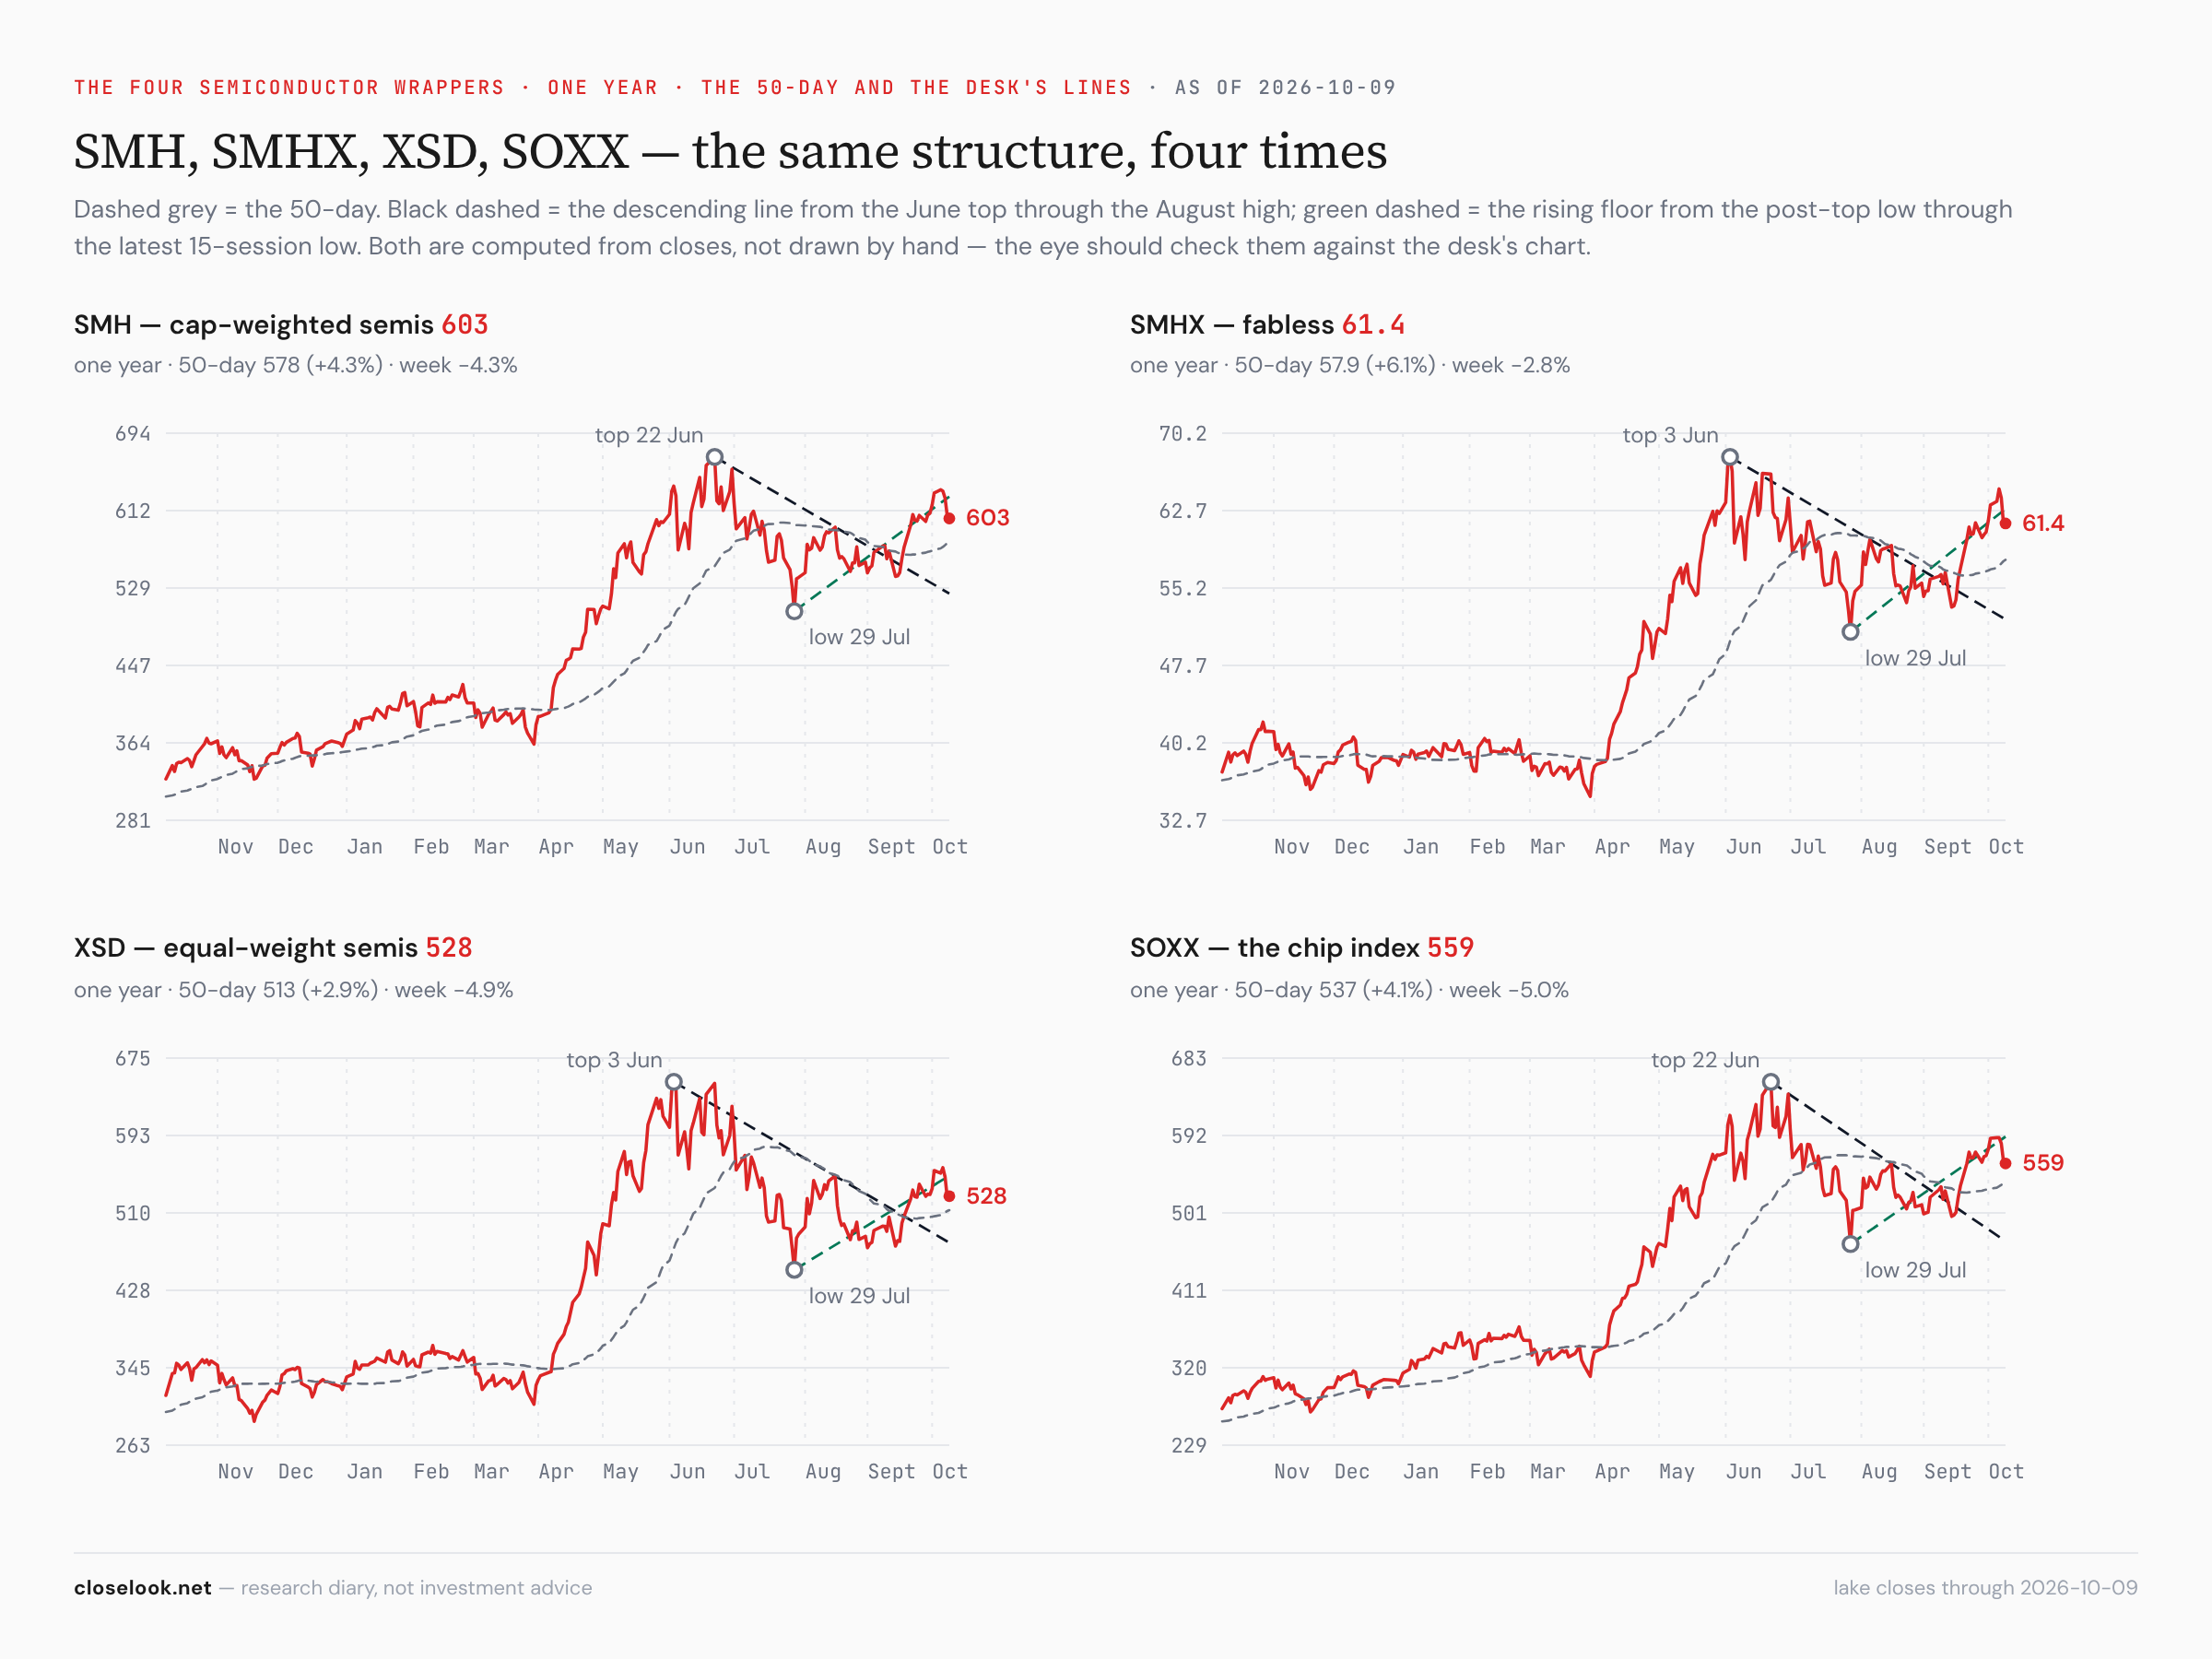
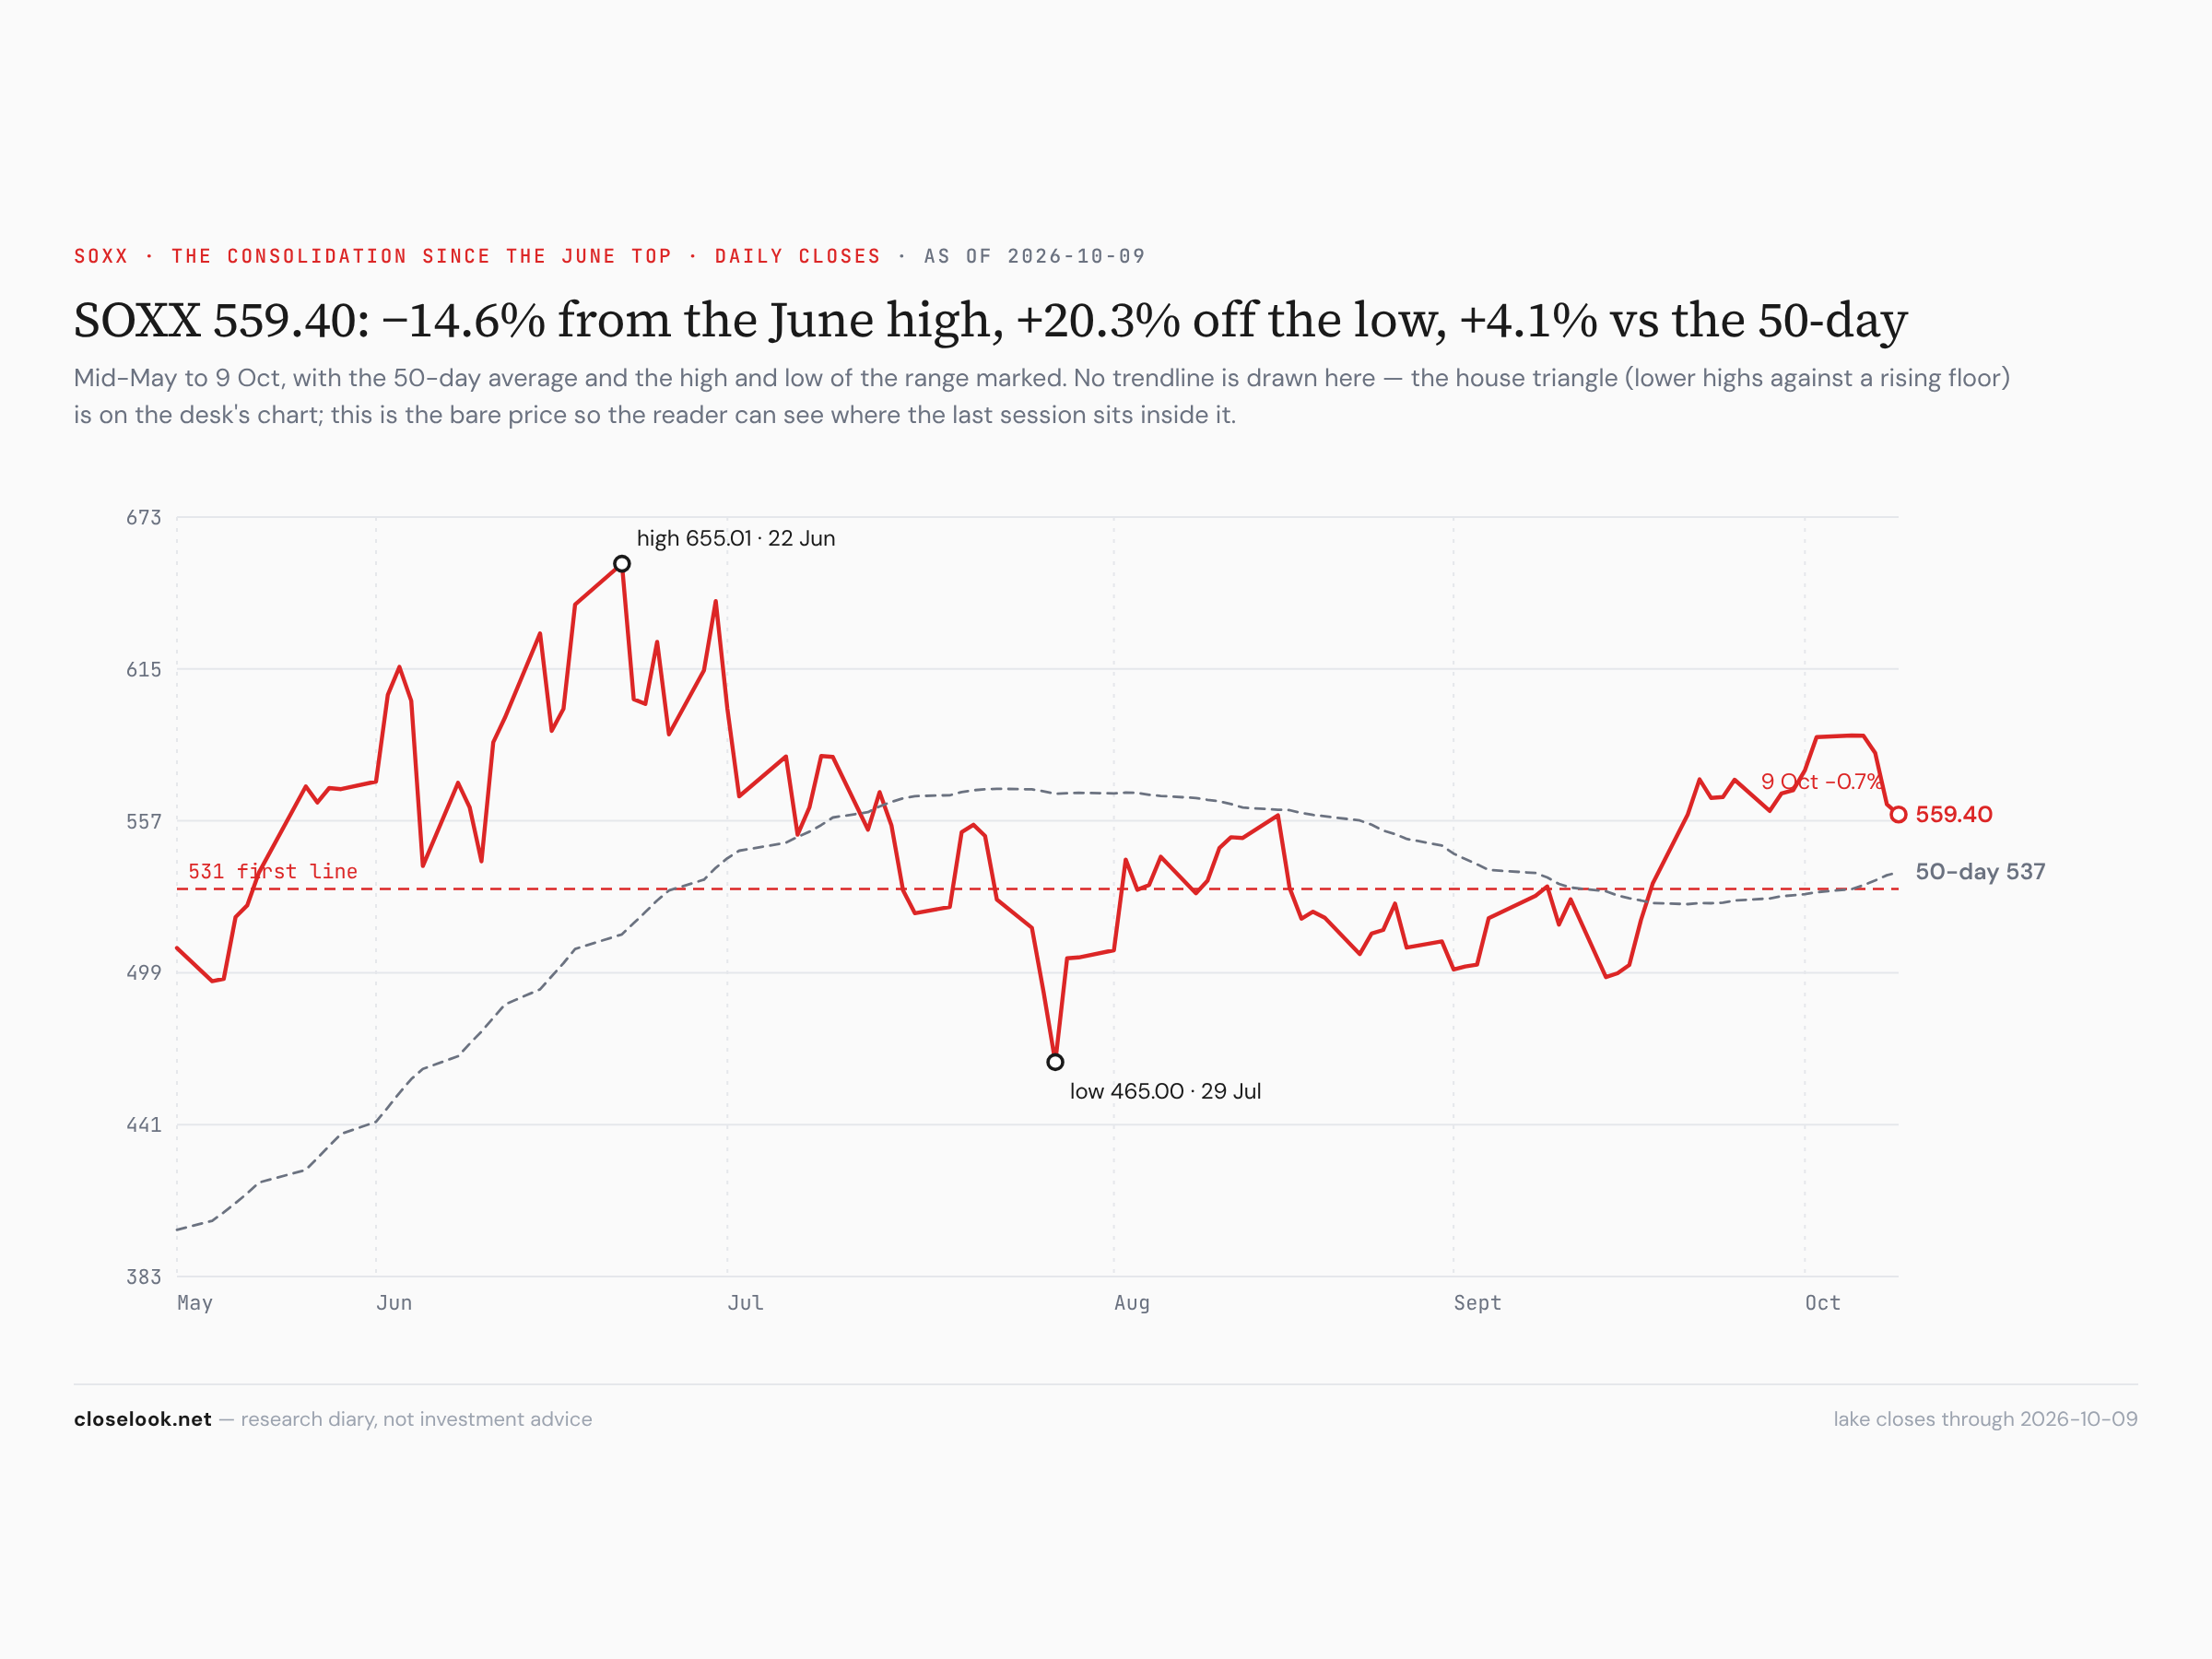
Software up, silicon down. Cybersecurity +5.06% to 110.00, cloud +4.51% to 30.11, software +3.91% to 112.67 — the last two at their highest closes of 2026. The chip funds: SOXX −5.01% to 559.40, XSD −4.91%, SMH −4.32%, the fabless fund −2.84%. The software-over-semis ratio rose 8.6% in one week and is now 43% above its June 22 low. Thursday did most of it: the chip index fell 3.4% on a report that put OpenAI's revenue nearer 50 billion dollars than 70 billion, and software rose the same day and again on Friday.
| Symbol | Name | Last | 5D | 1M | 3M | 6M | YTD |
|---|---|---|---|---|---|---|---|
| CIBR | First Nasdaq Cybersecurity | 110 | +5.06% | +16.43% | +16.70% | +74.38% | +53.95% |
| CLOU | Global X - Cloud Computing | 30.11 | +4.51% | +10.05% | +24.89% | +60.93% | +33.11% |
| IGV | iShares Expanded Tech-Software | 112.67 | +3.91% | +10.65% | +20.01% | +47.01% | +6.60% |
| FDN | First Dow Jones Internet Index | 301.32 | +3.28% | +4.65% | +9.30% | +22.85% | +11.94% |
| FINX | Global X - FinTech | 24.99 | +2.69% | -4.05% | -2.44% | +7.92% | -15.07% |
| ESPO | VanEck Video Gaming and eSport | 100.11 | +2.62% | +4.22% | +7.84% | +11.43% | -3.38% |
| DTCR | Global X - Data Center & Digit | 27.97 | +2.57% | -1.62% | -3.92% | +7.45% | +32.56% |
| LIT | Global X - Lithium & Battery T | 69.73 | +0.65% | -5.48% | -4.24% | -9.13% | +7.51% |
| NLR | VanEck Uranium and Nuclear | 103.35 | +0.59% | -15.94% | -8.60% | -24.31% | -16.79% |
| AIQ | Global X - Artificial Intellig | 66.6 | +0.56% | +3.88% | +4.34% | +34.95% | +30.95% |
| ARKK | ARK Innovation | 89.62 | -0.23% | +5.98% | +9.92% | +30.03% | +16.51% |
| SHLD | Global X - Defense Tech | 59.87 | -0.60% | -3.19% | -2.59% | -19.37% | -7.59% |
| GRID | First NASDAQ Clean Edge Smart | 180.89 | -1.10% | +0.42% | -1.78% | +2.47% | +18.21% |
| BOTZ | Global X - Robotics & Artifici | 35.48 | -1.53% | +0.85% | -3.14% | +1.60% | -2.07% |
| QTUM | Defiance Quantum | 152.06 | -2.56% | +2.88% | -2.26% | +30.93% | +38.66% |
| WTAI | WisdomTree Artificial Intellig | 44.16 | -2.62% | +3.54% | +0.27% | +42.27% | +51.54% |
| SMHX | VanEck Fabless Semiconductor | 61.42 | -2.84% | +8.74% | -0.25% | +49.38% | +61.52% |
| SNSR | Global X - Internet of Things | 48.61 | -3.31% | +3.28% | -0.57% | +21.98% | +31.54% |
| SMH | VanEck Semiconductor | 603.33 | -4.32% | +5.06% | -0.72% | +40.21% | +67.53% |
| XSD | S&P Semiconductor | 527.93 | -4.91% | +6.51% | -7.30% | +44.92% | +64.16% |
| DAPP | VanEck Digital Transformation | 17.82 | -6.75% | -11.30% | -5.36% | +8.20% | +7.80% |
Sorted by Weighted Alpha (leaders → laggards) · Barchart, close of week.
The names in one line each. Zscaler +18.9%, GitLab +10.7%, Palantir +10.8%, Atlassian +10.1%, Okta +9.8%, Veeva +8.3%, Snowflake +8.2%, MongoDB +7.8% on the way up; Aehr −21.1%, IREN −15.7%, Arm −13.4%, Nebius −9.0%, CoreWeave −8.4%, SanDisk −8.0%, Coherent −7.3%, KLA −5.5%, Micron −4.3%, Nvidia −2.0% on the way down. The Magnificent Seven fund rose 1.63% — Microsoft +3.4%, Amazon +4.3%, Alphabet +2.4% — and closed at 73.77, a record close of 73.90 on Tuesday.
The four indices: Dow, S&P 500, Nasdaq 100, Russell 2000
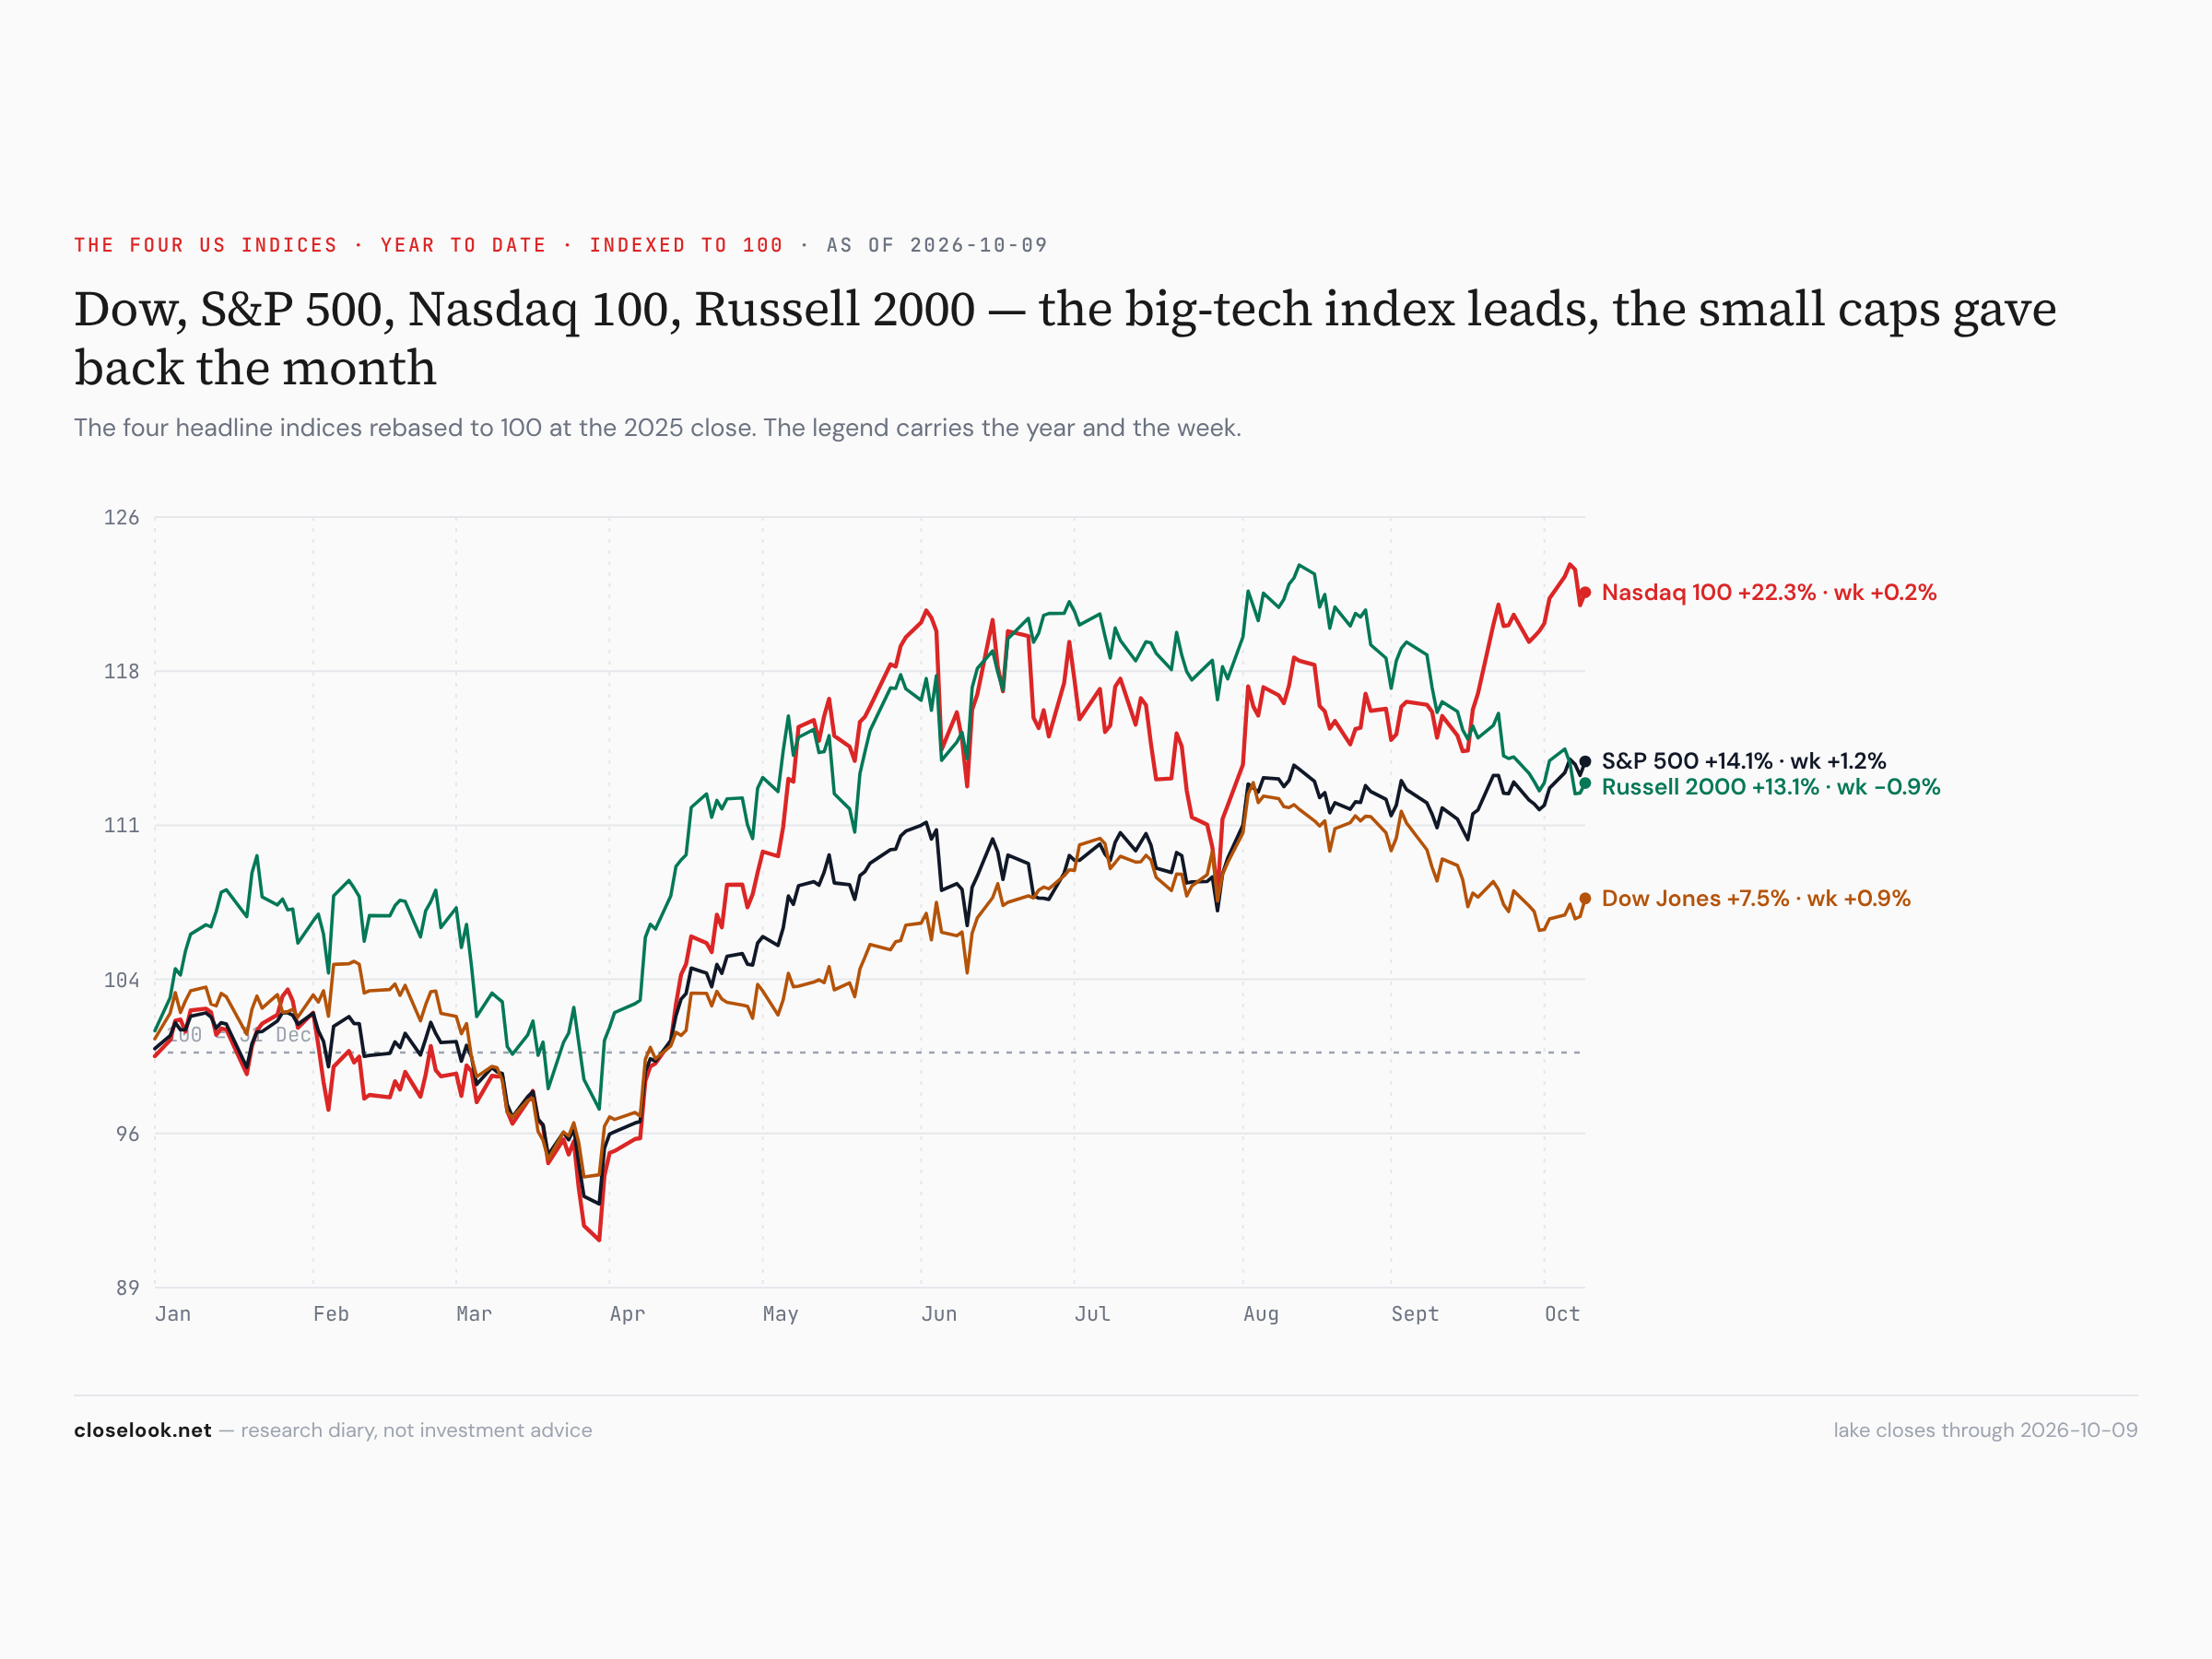
The S&P 500 +1.15% to 7,812, the Nasdaq 100 +0.24% to 30,883, the Russell 2000 −0.94% to 2,806. The S&P and the Nasdaq made records on Tuesday; the Russell is 8.5% under its August high. The Dow sits between them on the chart. Two of the four at their highs, one in the middle, one still well under: the broadening is in the large caps, not yet in the small ones.
The Treasury curve, one month to thirty years
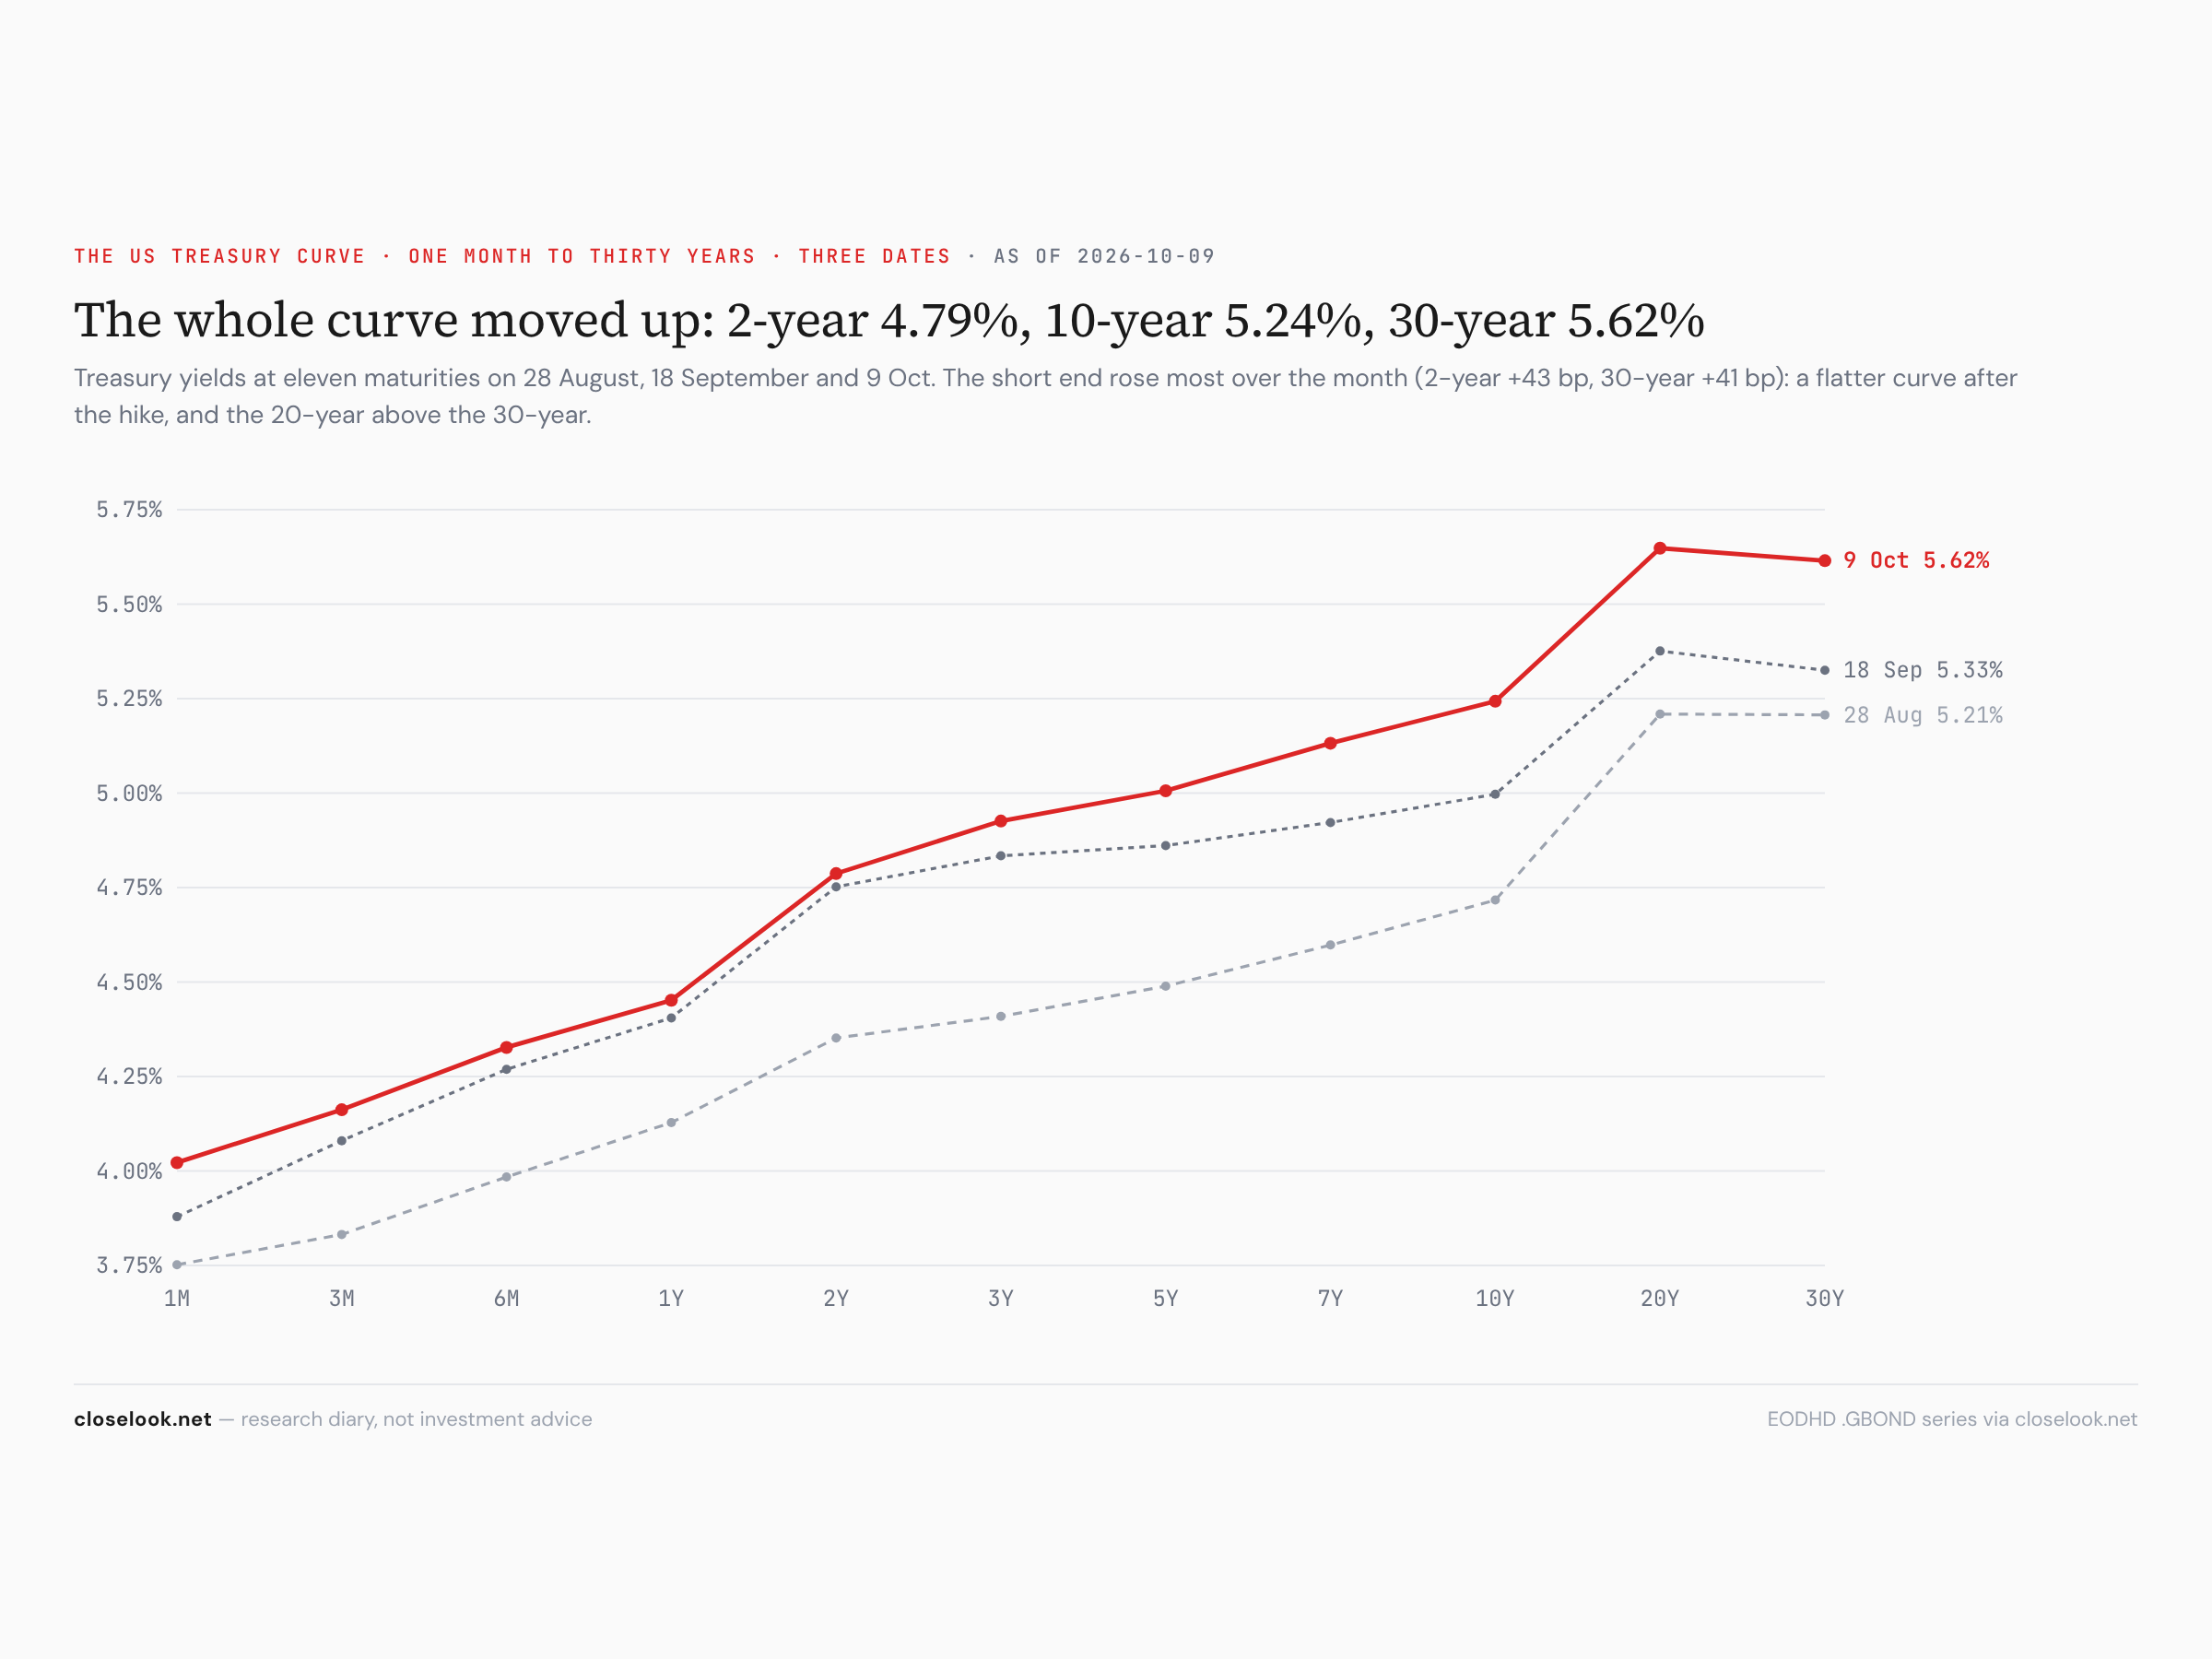
Over the month the whole curve rose — the 2-year to 4.79%, the 10-year to 5.24%, the 30-year to 5.62% on the vendor curve — and over the week the long end eased: the ten-year from its 5.35% touch on Monday to 5.24%, the thirty-year to 5.60% on the sovereign board. The real yield did the same in miniature: 2.95% on Monday, 2.91% on Friday. The level is the highest since 2008; the direction, for one week, was flat to lower.
The dollar
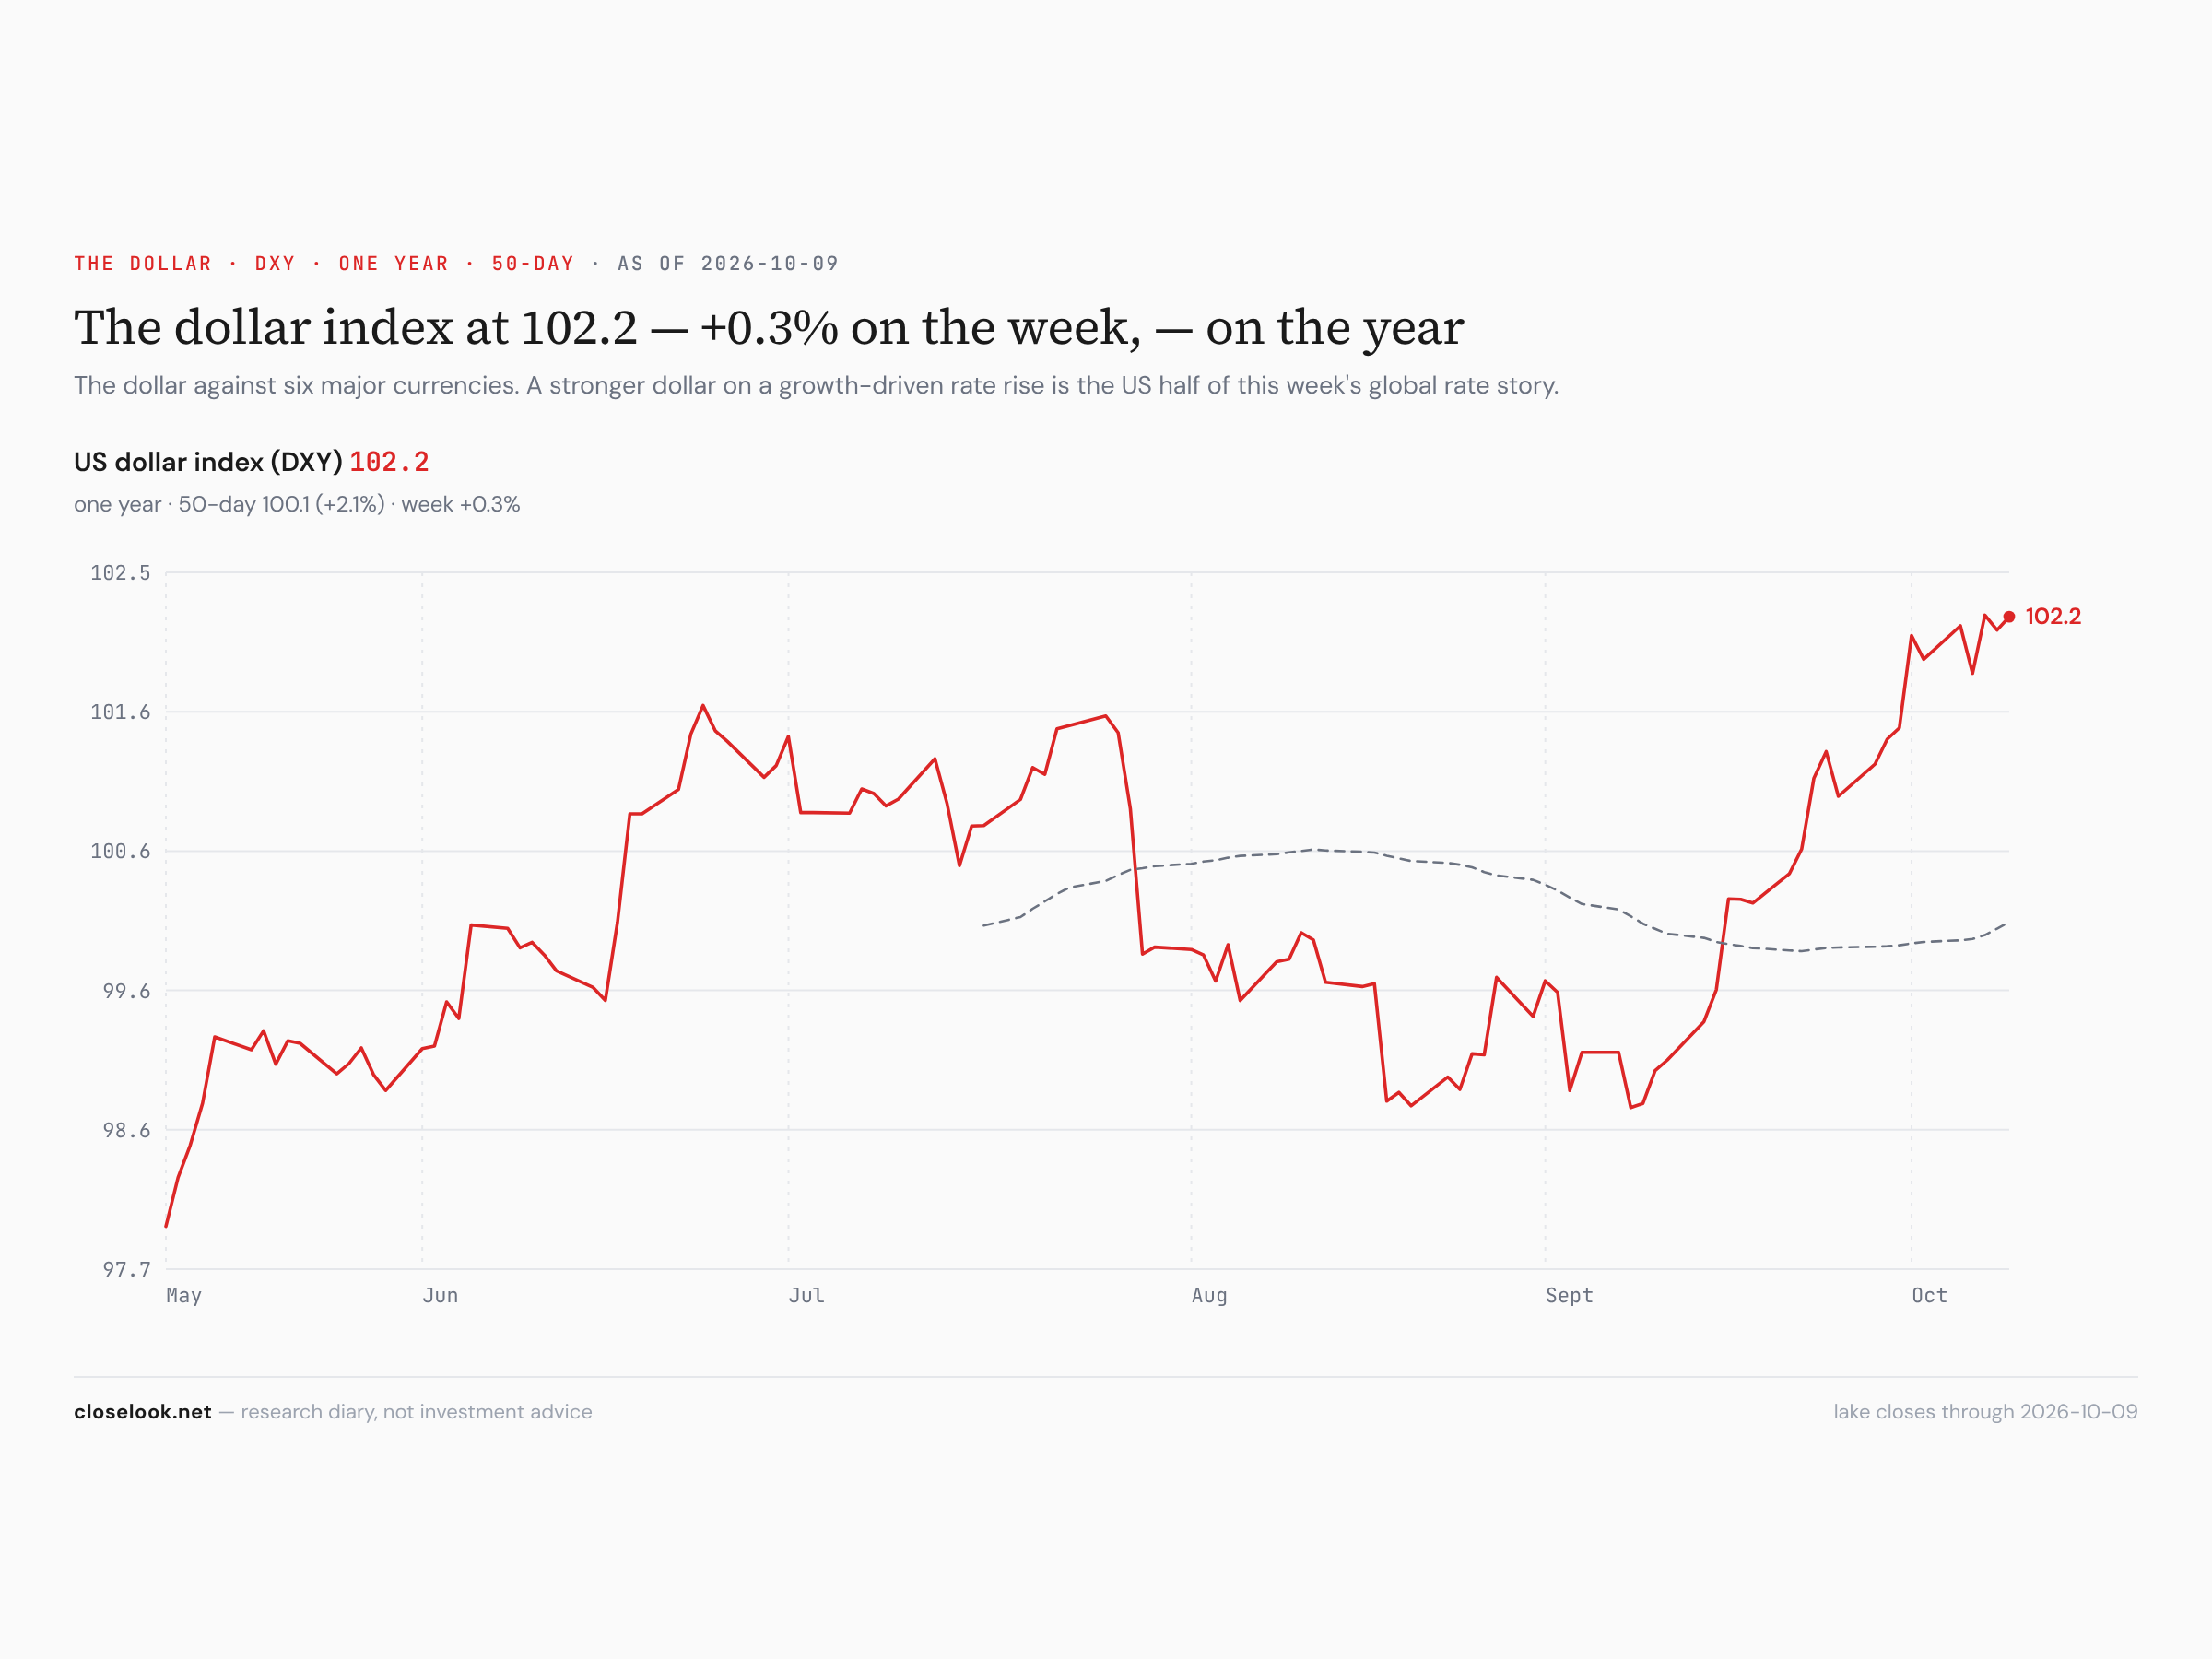
The dollar index rose 0.29% to 102.23, the dollar fund made a new high close of the year on Wednesday. A dollar at its high in a week the market priced a peak in rates is a contradiction worth watching: either the dollar is pricing growth that keeps rates up, or the stock market is early.
2 · The State
The mechanism, named: a peak priced in sector order. Put the week in order. Monday: the ten-year touched 5.35% and the real yield 2.95%, Brazil's fund jumped 12.5% on its election, US stocks rose anyway and the average stock kept pace. Tuesday: the S&P 500 and the Nasdaq 100 at records, Marvell +7.6% on its investor day, AMD at a record; the storage makers fell — Seagate −9.2%, Western Digital −6.9% — and the chip-machine makers with them. Wednesday: small caps −1.3%, the power and cooling suppliers to AI data centres sold; the Fed's minutes pointed to another hike. Thursday: Brent above 103 dollars, energy the strongest sector; the OpenAI revenue report — the chip index −3.4%, Broadcom −4.4%, Micron −4.8%, CoreWeave −7.8% — and software up; PepsiCo beat and cut its outlook; TSMC's September sales +54.6% on the year. Friday: the cloud fund +2.9% for a second up day, Zscaler +6.4%, Datadog +5.7%; Delta cut its outlook on jet fuel; the S&P +0.6% with the average stock alongside.
Hawkish words and the highest real yields since 2008, and the sectors that suffer most from high rates were the best of the week. Whatever the minutes say, this is not the price action of a market that expects rates to keep rising sharply. The market is not reading the Fed's next step; it is reading the step after it.
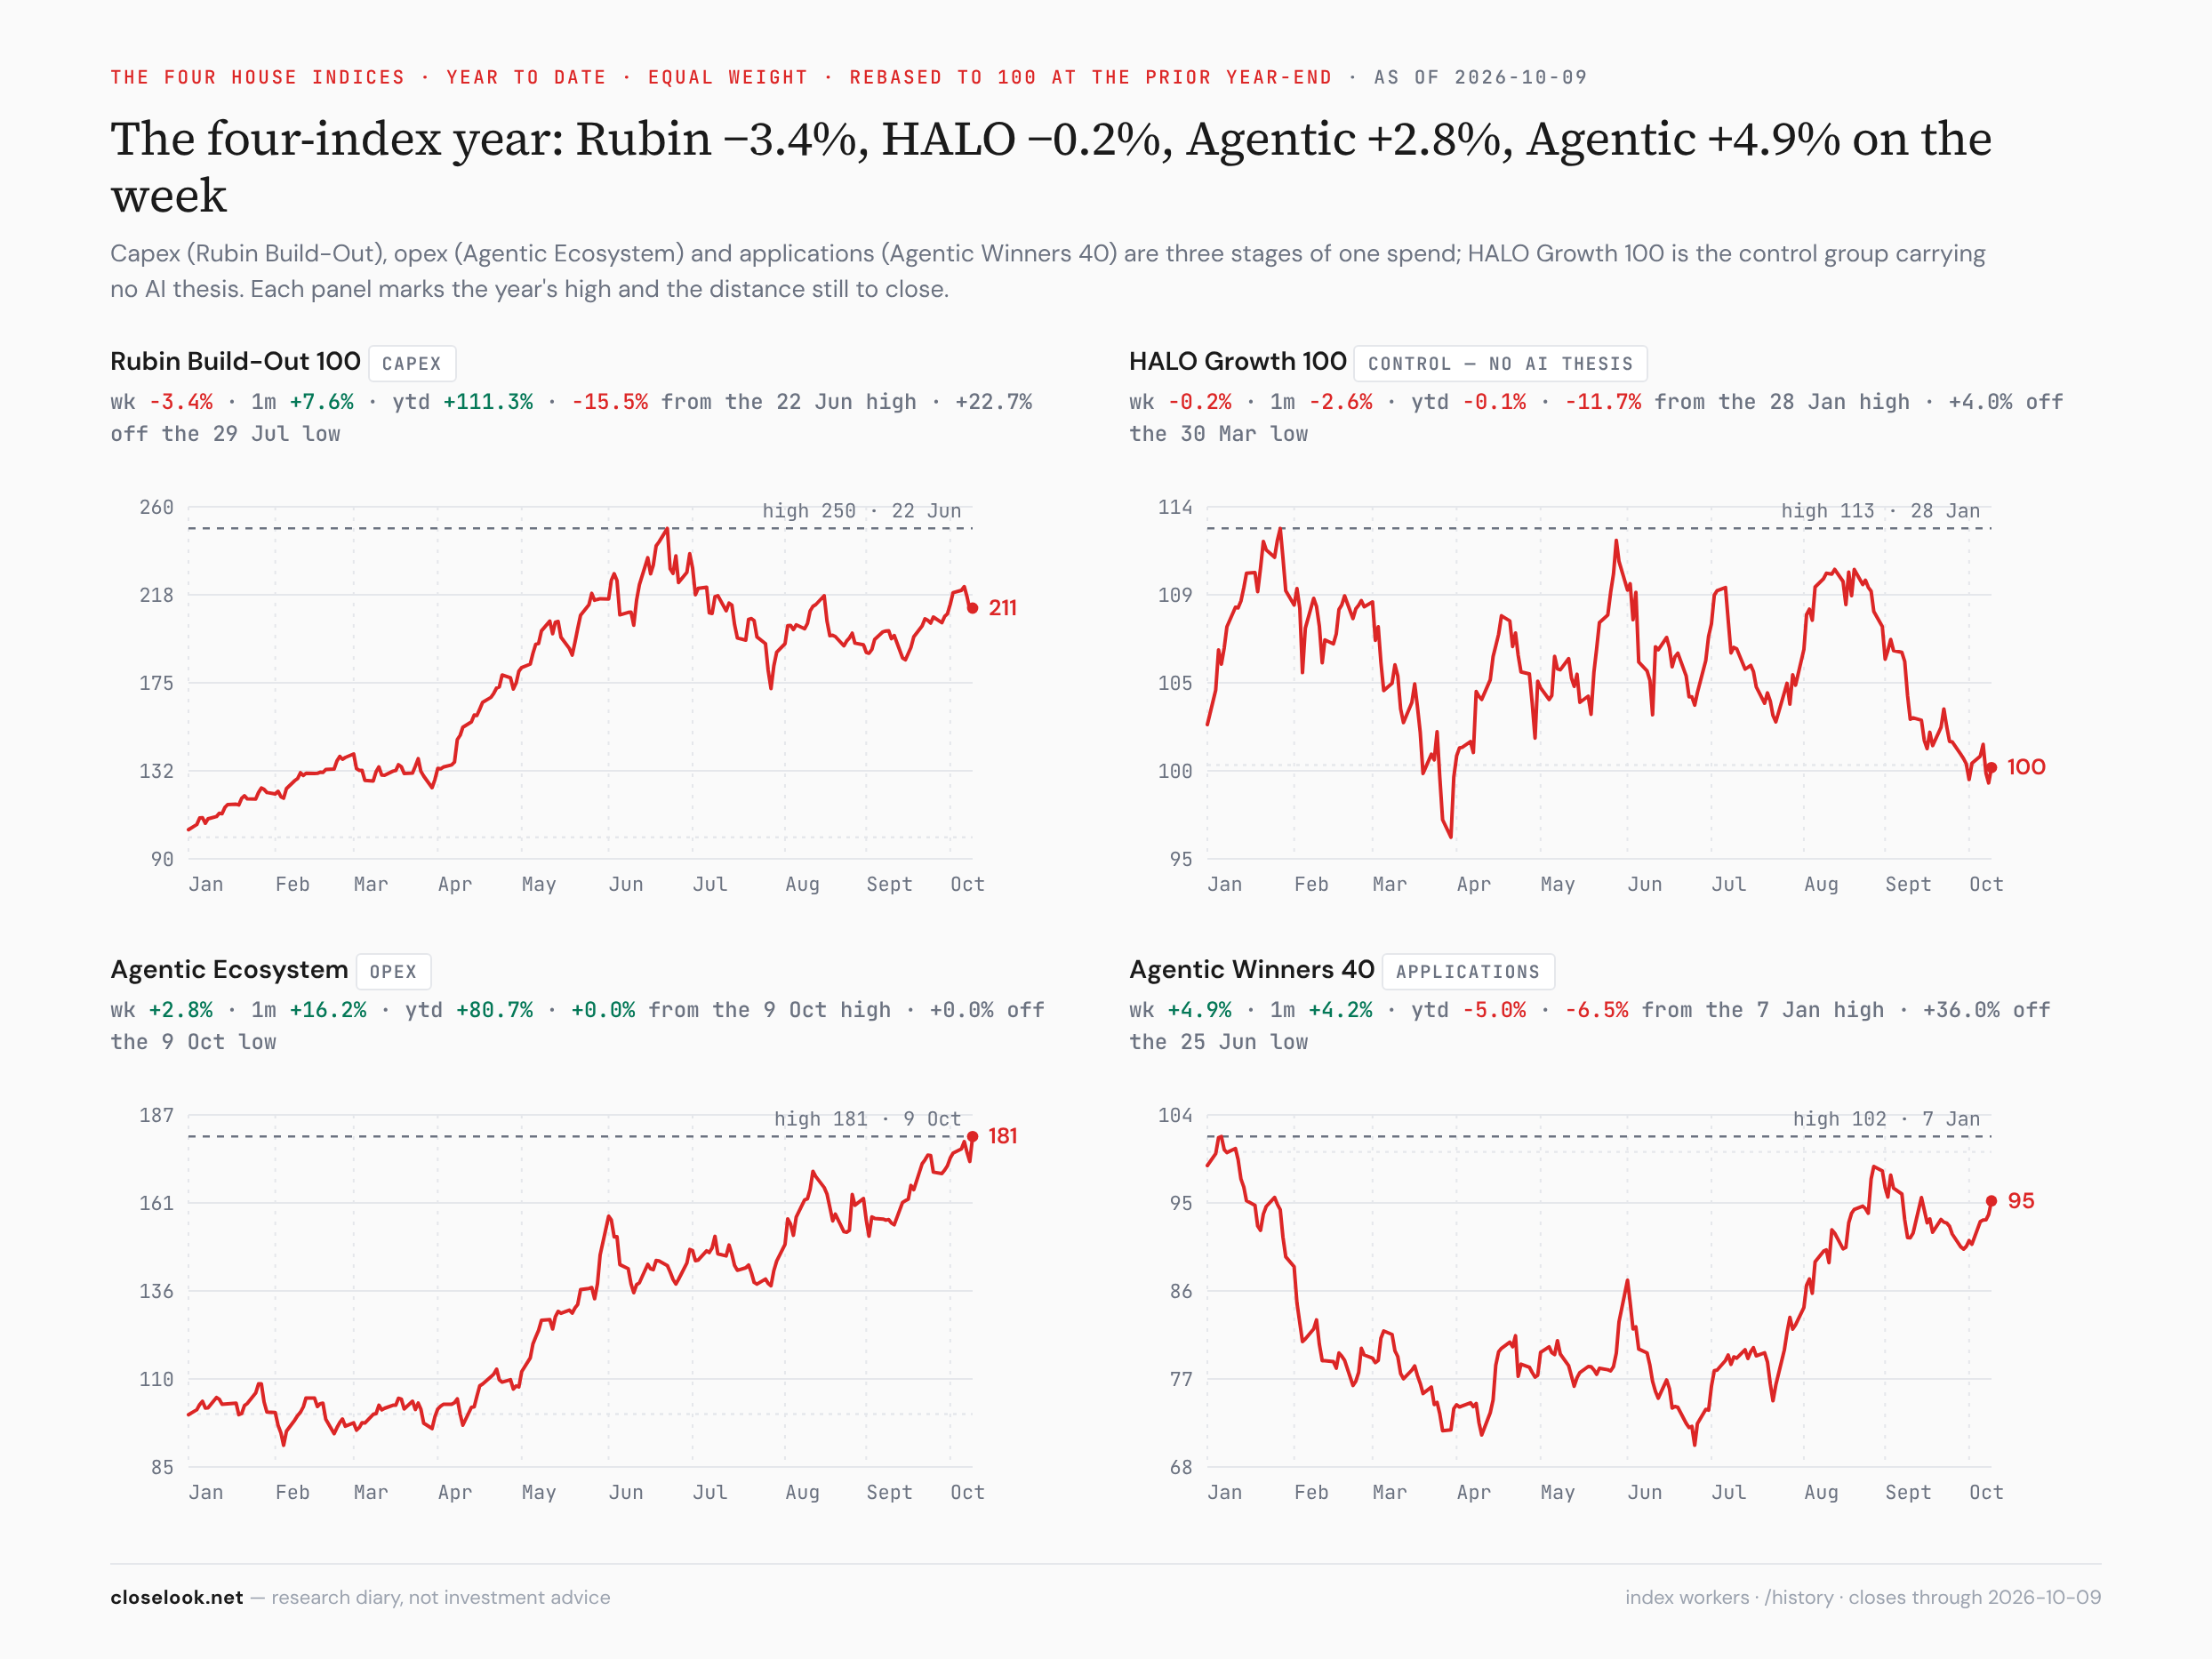
Why the peak trade and the chip sell-off are the same trade. A peak in rates helps the companies whose value sits in steady cash today — utilities, staples, insurers, health care — and it helps less the companies whose value sits in spending that has to be financed tomorrow. This week the second group got a second question on top: the OpenAI report asked whether AI's biggest buyers will earn enough to keep buying. The chip fund SOXX is 14.6% under its June 22 high, the AI builder index lost 3.4% with 110 of its 126 names losing strength, while the applications index rose 4.9% with 33 of 40 names gaining. Money left capital spending and went to cash flow — inside tech and outside it.
The table, applied. Last Saturday's Global letter set out four combinations of real yields and earnings. For most of 2026 the market sat in the second row: real yields rising because growth is strong, stocks rising with them. This week it traded the third row — real yields peaking, earnings resilient, the setup that can help put in a bottom — for the sectors that had fallen. It did so with the level still at its highest since 2008 and the direction only one week flat. The reporting season decides whether the earnings half of that row holds.
The confirmation held. QQQ's lowest close of the week was 747.58 on Thursday — above 746.16, the line confirmed a week ago. The index absorbed a 5% chip week without giving up its base.
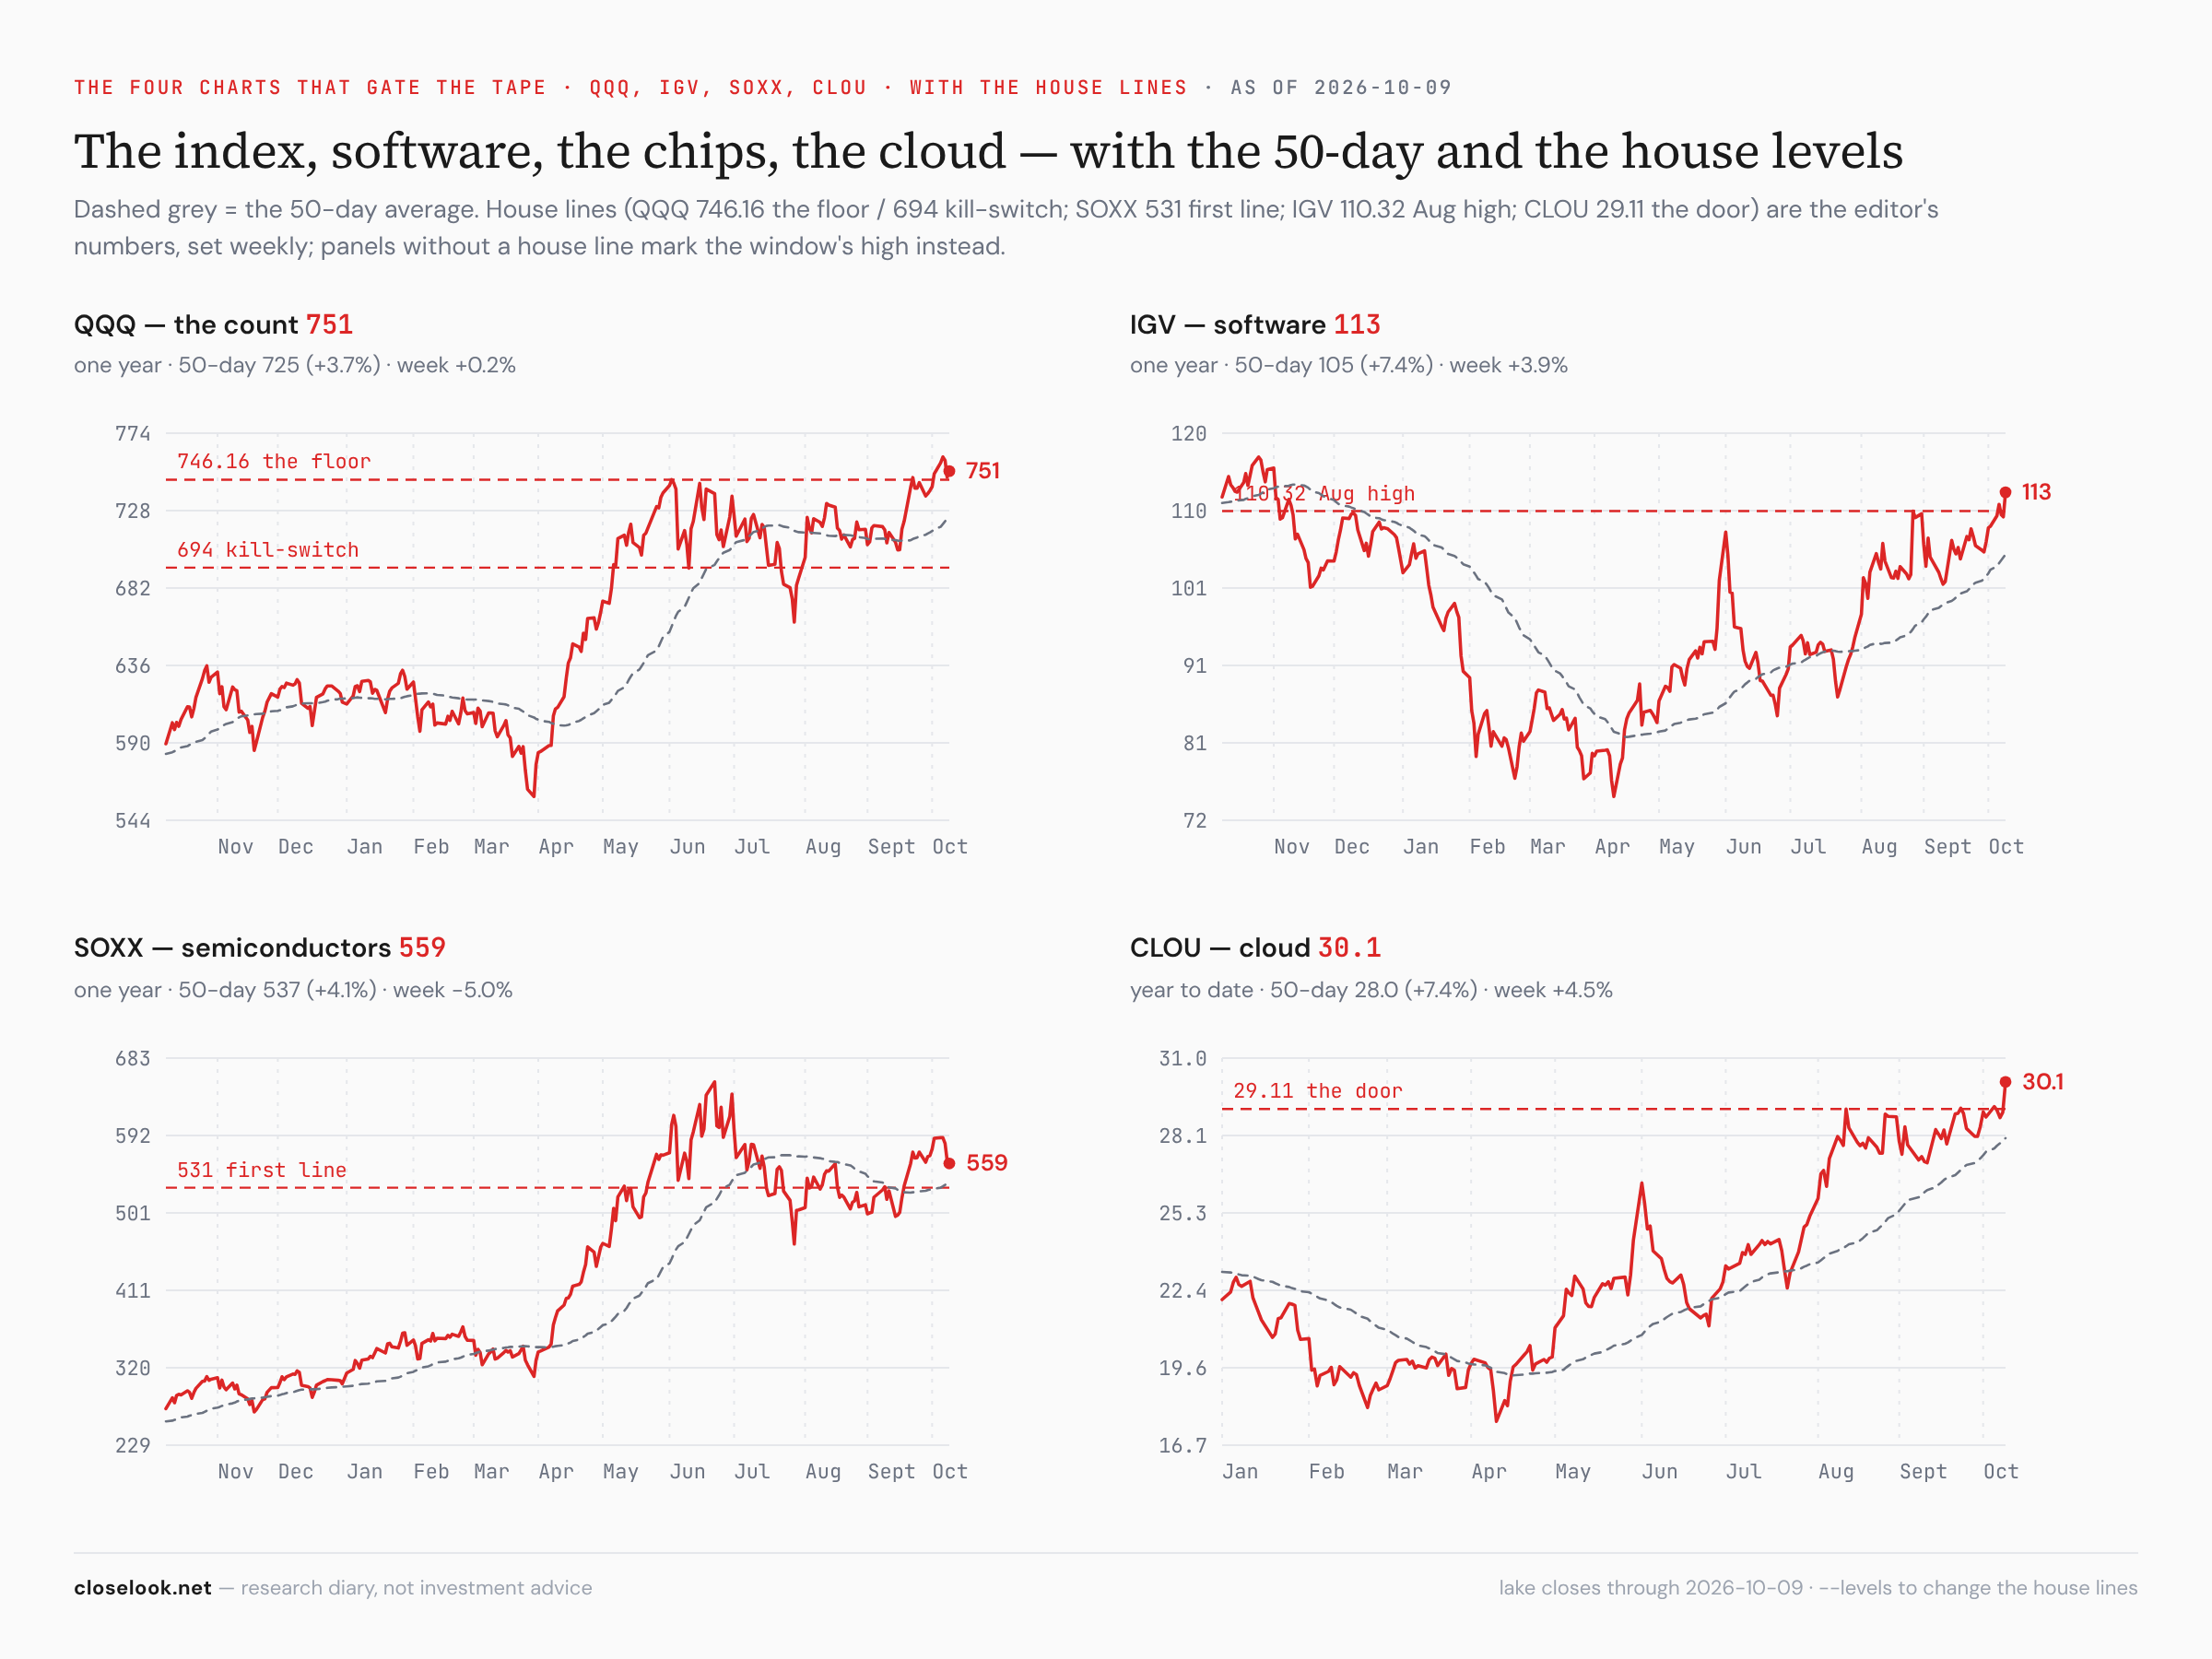
The chips — the dip. SOXX 559.40: 14.6% under the June high, 4.1% above its 50-day, 5.3% above 531, the first line under it. SMH 603.33, 9.8% under its June high; XSD 527.93, 18.6% under. This week they are the dip the season was expected to offer.
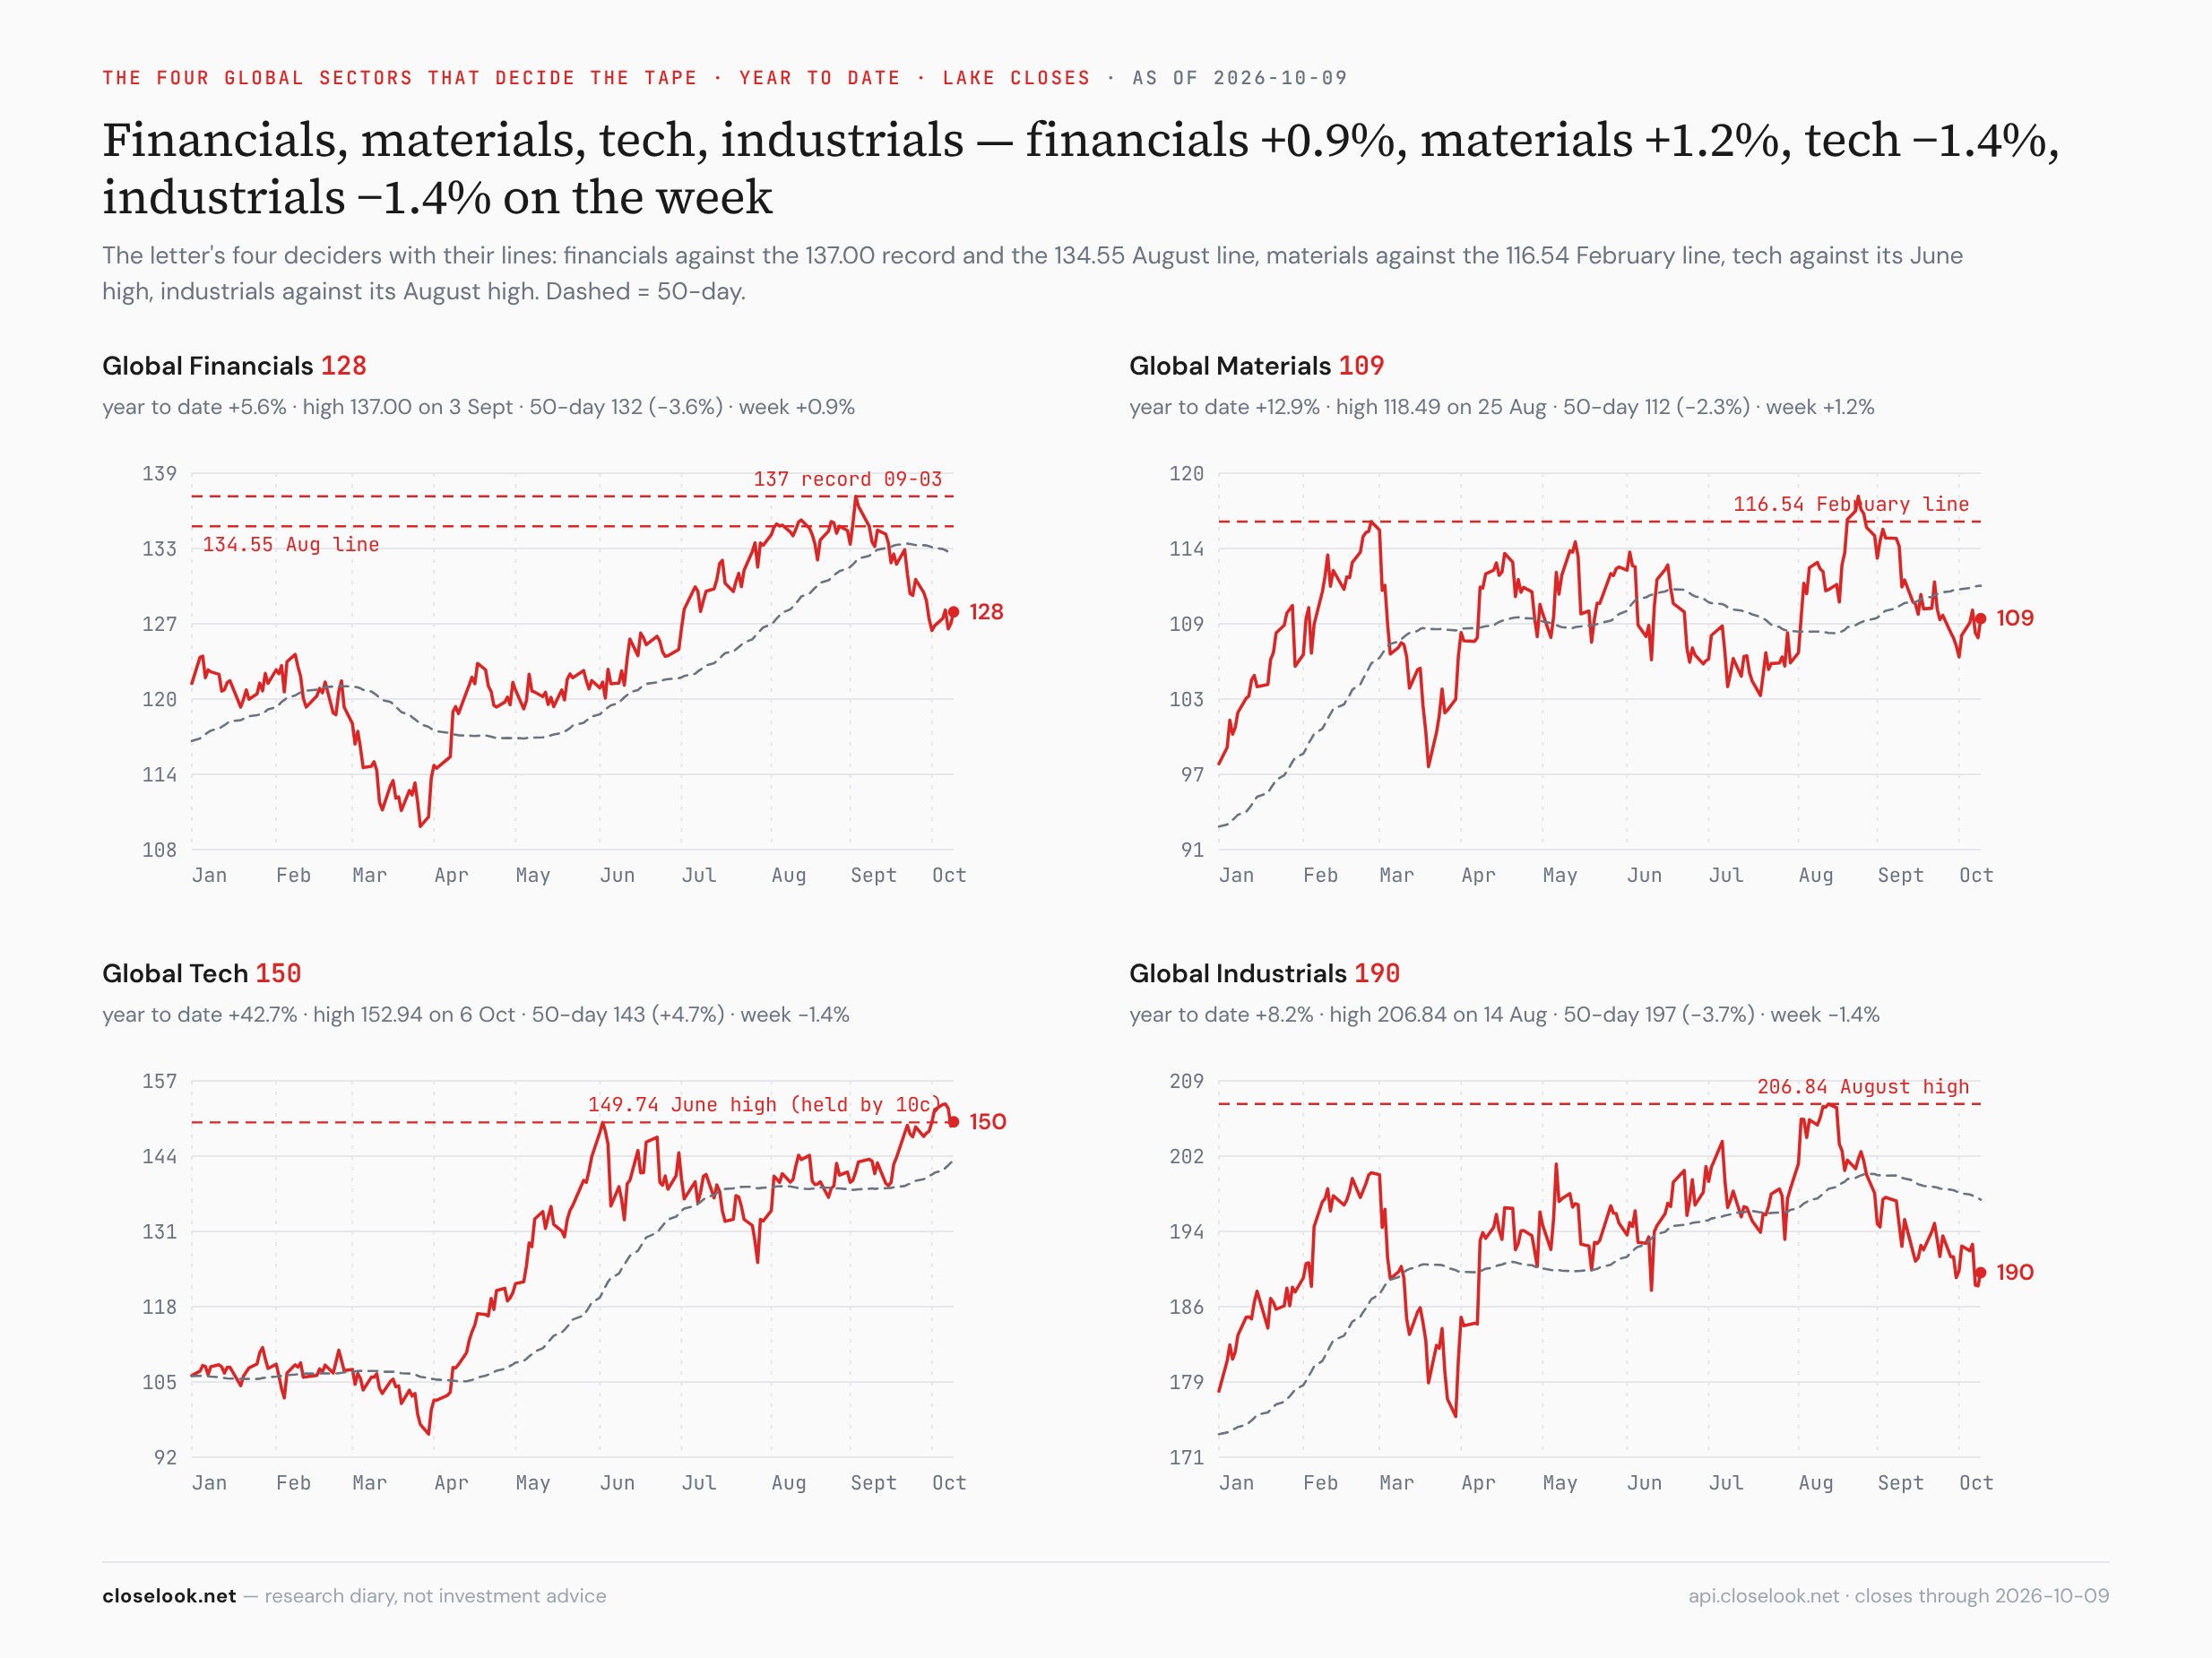
Software — through its lines. IGV 112.67 — through the 110.32 August high, its best close of 2026, 7.4% above its 50-day. CLOU 30.11 — through the 29.11 door, a year high. CIBR 110.00 — 10.9% above its 50-day. Last week software held its year-end line; this week it broke out above its year's range.
3 · The Outlook
The three-index read — capex down, opex and applications up. Capex (Rubin Build-Out) −3.44% to 2,094.58, +103.8% on the year, 15.5% under its June high. Opex (Agentic Ecosystem) +2.76% to a record 1,786.36, +81.0%. Applications (Agentic Winners 40) +4.91% to 942.64, all nine sub-indices green, −3.7% on the year. The house AI board counts the flow behind it: 110 of 126 Rubin names losing strength, 22 of 34 Ecosystem names and 33 of 40 Winners names gaining. HALO — growth with no AI thesis — was flat at −0.23%.
The regime gauges. The Money Temperature board read 57, unchanged — mixed, transitional, not a signal. The momentum/low-vol pair turned toward low-vol for the week from the 96th percentile. Structural inflation reads "contained", its direction flat — one reason a market can price a peak while the Fed talks about a hike.
4 · What May Lie Ahead
The fourth quarter — positive for the US, and broader. This letter's frame for the rest of 2026, unchanged: seasonally the strongest stretch of the calendar, expected to be positive to year-end. What this week adds is breadth. A rally carried by one sector is a bet on that sector's earnings; a rally in which utilities, staples, financials, health care and the consumer rise together is a bet on the economy and on rates. The second kind usually lasts longer.
Last year's fourth quarter — the precedent inside tech. The calendar's strong quarter was not strong for all of tech in 2025. The tech sector fund peaked on 29 October 2025 and fell 10.5% by 20 November; software peaked on 27 October and fell 13.9% into the same day, and ended the quarter −8.1%. The chip funds went the other way — +11% for the quarter, with their own 10% drop only in December — and health care was the best sector at +11.2%. The S&P still finished the quarter +2.4%. The lesson for this one: a positive fourth quarter for the index can hold a month-long correction in one part of tech, and the part rotates. This year the chips lead into it and software follows; last year it was the reverse.
The stance — buy dips, now in the chips. Two weeks ago this letter expected uncertainty before the reporting season and set the stance: buy dips, do not chase. The chips delivered the first dip. Whether it is the one to buy depends on the first reports from the AI supply chain, which now face a question about 2027 spending, not about this year's.
The levels, updated. QQQ 751.27 — 746.16 the floor, held on every close; 694 the kill-switch, 7.6% below; the 50-day at 724.52. SPY 778.57 — 779.09 the record close; 767.57 the 50-day. The equal-weight S&P 213.04 — still 1.5% under its 50-day; a close above 216.30 is the confirmation of the broadening. SOXX 559.40 — 531 the first line under it, 537.37 the 50-day. IGV 112.67 — the 110.32 August high is the floor now. CLOU 30.11 — 29.11 the floor now. QQXT 98.15 — above 96.92; the year's low at 95.89 is the line. XLF 54.73 — 53.40, the 30 September low, is the line; 58.56, the September 3 high, is 7.0% above. TLT 77.98 — 74 below, 81.2 above.
The rate-peak checklist — what would confirm it. The groups that have not joined are the test: homebuilders back above their 50-day averages, the bank funds off their 7 October lows, small caps back above 291, and the equal-weight S&P above its 50-day. Two of those in the next fortnight would turn this week's sector order into a trend. None of them, with real yields back above 3%, would make it a week.
The week's calendar. Tuesday: PepsiCo's window closes. Wednesday: Delta's window closes. Wednesday and Thursday: ASML's and TSMC's quarters — the first word from the AI supply chain on next year. The big banks open the reporting season this month — the first read on the loans and the mortgages the market just started to price.
The print record
Five windows closed this week. Micron −0.1% — flat, the card's first flat window, after a record quarter the market had already bought. Jabil +4.9% — paid. Accenture −8.9% — sold, the record-bookings jump of the print day sold over the window. Nike −1.5% — flat. Penguin Solutions +18.8% — paid, from 64.21 to 76.28 on a double beat, the card's third payment in a row.
Two windows open. PepsiCo beat on Thursday and cut its profit outlook; the window runs from Thursday's 128.34 — paid at 132.19, sold under 124.49; Friday's 125.97 sits inside the band. It is scored on Tuesday's close. Delta reported before Friday's open and cut its 2026 outlook on jet fuel; the window runs from Friday's 82.17 — paid at 84.64, sold under 79.70 — and is scored on Wednesday's close.
5 · The AI Build-Out Portfolio
AI Buildout — 36 positions · unrealized +33.3% · benchmark Nasdaq-100 · snapshot Oct 9, 2026
| # | Symbol | Name | Weight | Unreal. |
|---|---|---|---|---|
| 1 | TOELY | — | 12.3% | +459.4% |
| 2 | US Dollar | — | 4.8% | +0.0% |
| 3 | NET | — | 4.0% | +84.3% |
| 4 | ATEYY | — | 3.7% | +40.0% |
| 5 | NVDA | — | 3.4% | +25.7% |
| 6 | CIBR | — | 3.3% | +23.6% |
| 7 | DDOG | — | 3.3% | +134.2% |
| 8 | PLTR | — | 3.1% | +45.8% |
| 9 | TSM | — | 3.1% | +24.4% |
| 10 | DOCN | — | 3.0% | -11.2% |
| 11 | NTRA | — | 3.0% | +94.3% |
| 12 | SIEGY | — | 2.9% | -2.5% |
| 13 | RBRK | — | 2.8% | +129.4% |
| 14 | ASX | — | 2.8% | +100.0% |
| 15 | SNOW | — | 2.8% | +102.3% |
+ 21 more positions · full per-position cost basis & P&L is C+ subscriber-only.
What we did this week: nothing. No buys and no sells. Dividends were reinvested in Kulicke and Soffa, SK Hynix and TSMC; Saturday's Pulse has the full ledger.
The book, marked — down about two percent. The equity lines closed Friday at a market value of about $606,900 — −2.2%, or about −$13,400 on the week, by the engine mark with one correction: the portfolio tracker still quotes the Tokyo Electron ADR at its pre-split 164.55 dollars, five times too high. Priced from Tokyo — 12,445 yen, half a share per ADR, 158.25 yen to the dollar — the ADR is worth about 39.32 dollars and the line about $19,700, up about 2.6% on the week. Net liquidation by the same mark is about $747,600, a headline return of about +49.5% on the $500,000 deposited.
What paid and what charged. Palantir +10.8% (+$2,030, the book's best), Snowflake +8.2% (+$1,393), Datadog +5.8% (+$1,203), the cybersecurity fund +5.1% (+$1,061), Rubrik +5.5% (+$984), Cloudflare +3.4% (+$890), Advantest +2.2% (+$535), Tokyo Electron about +2.6% (about +$500). The charges: SK Hynix −13.4% (−$2,610, the book's worst), BE Semiconductor −13.1% (−$2,434), Infineon −9.7% (−$1,770), Nebius −9.0% (−$1,630), SanDisk −8.0% (−$1,382), Coherent −7.3% (−$1,221), Tempus −7.4% (−$1,140), Samsung −7.2% (−$1,104). Eleven of thirty-five lines green. Last week the builders paid the book and the applications charged it; this week the order reversed, line for line.
What we plan to do — nothing on Monday, and the dips are in the book's own names. The book is built for the build-out, and the build-out had a bad week. That is the dip the plan said it would use: add on weakness, not on strength, and act on the close. The closes that matter are ASML's and TSMC's weeks.
The four tradable books, open for inspection. Alongside the reference portfolios on this site, the four Closelooknet-companion wikifolios — the tactical book, the AI-cycle thesis book, the ETF core, and the non-tech growth compounder — publish their own ledgers on the wikifolio platform, every transaction visible trade by trade, via Trade the Look. A research diary made investable for its author; not a recommendation.
6 · What May Go Wrong
One: the Fed means it. The minutes pointed to another hike; the market priced the peak anyway. If the next data — inflation, jobs — give the Fed its reason, the real yield goes through 3% and the sectors that rose this week on rates give it back first. The ten-year real yield above 3% on a weekly close is that week.
Two: the peak trade without the peak buyers. Homebuilders, regional banks and small caps did not join. A rate peak that the most rate-sensitive groups do not believe is a rotation into safety, not an early cycle. A second week of homebuilders and regional banks at their lows would say the defensive bid was fear, not anticipation.
Three: the capex question spreads to software. The software rally rests on the same customers' budgets as the chips. If ASML or TSMC says 2027 spending slows, the sellers of AI may follow the builders. A week in which software falls with the chips is the sign.
Four: the dollar and the rates disagree. A dollar at its high is not what a rate peak usually looks like. If the dollar is right, the long end has not peaked and this week's sector order reverses.
Five: the chip dip becomes a chip trend. SOXX is 14.6% under its June high with 531 as the first line. A weekly close under 531 turns the dip into a lower high and a lower low — and the build-out book is where it would show first.
7 · Knowledge Corner
What a peak in interest rates looks like in the sector order. When investors start to believe that rates have stopped rising, they rarely buy everything at once. They move in a rough order, by how directly each business depends on the price of money. First the bond substitutes: utilities and consumer staples, companies with steady dividends that compete with bonds for income — when bond yields stop rising, their dividends look better. Then the balance sheets: financials and real estate, whose value depends on the shape of the yield curve and the cost of funding. Then the borrowers: homebuilders, whose buyers need a mortgage, regional banks that lend to small businesses, and small caps that carry more floating-rate debt. This week the market moved through the first two steps — utilities turned on 28 September, financials on the 30th, staples on 1 October, health care on the 2nd, real estate on the 7th — and not the third: homebuilders, regional banks and small caps fell. The order is not a law, and it can stop at any step. But it is a useful way to read a rally that is not about tech: the further down the list the buying reaches, the more the market believes that the next move in rates is down. Right now it believes it about halfway.
8 · Final Words
The Fed pointed to another hike. The real yield touched its highest level since 2008. And the market traded the week as if the top in rates were in.
Utilities turned first, then the financials, the staples, health care, and real estate — one after another over eight sessions. The equal-weight S&P beat the Nasdaq; the Nasdaq without its tech stocks rose 2.4% a week after its low of the year; the consumer names rose with the defensives. The chips paid for it — down five percent on a question about who pays for AI next year — while software, cloud and security made highs of the year. The Nasdaq 100 fund held its confirmation line on every close.
What has not joined yet is the honest half of the picture: homebuilders, regional banks and small caps fell. The market priced a peak in rates for the large and the steady, not yet for the borrowers.
Price is the only truth. This week it said: the rally broadened. The equal-weight S&P against its 50-day, the homebuilders and the regional banks off their lows, 3% on the real yield, 746.16 on the Nasdaq fund and 531 on the chips — and ASML and TSMC on Wednesday and Thursday — will say whether the breadth is the start of the next leg or the market taking cover.