AI Board · closes through 12 Oct 2026
AI Indices — Rubin, Ecosystem and Winners, every session
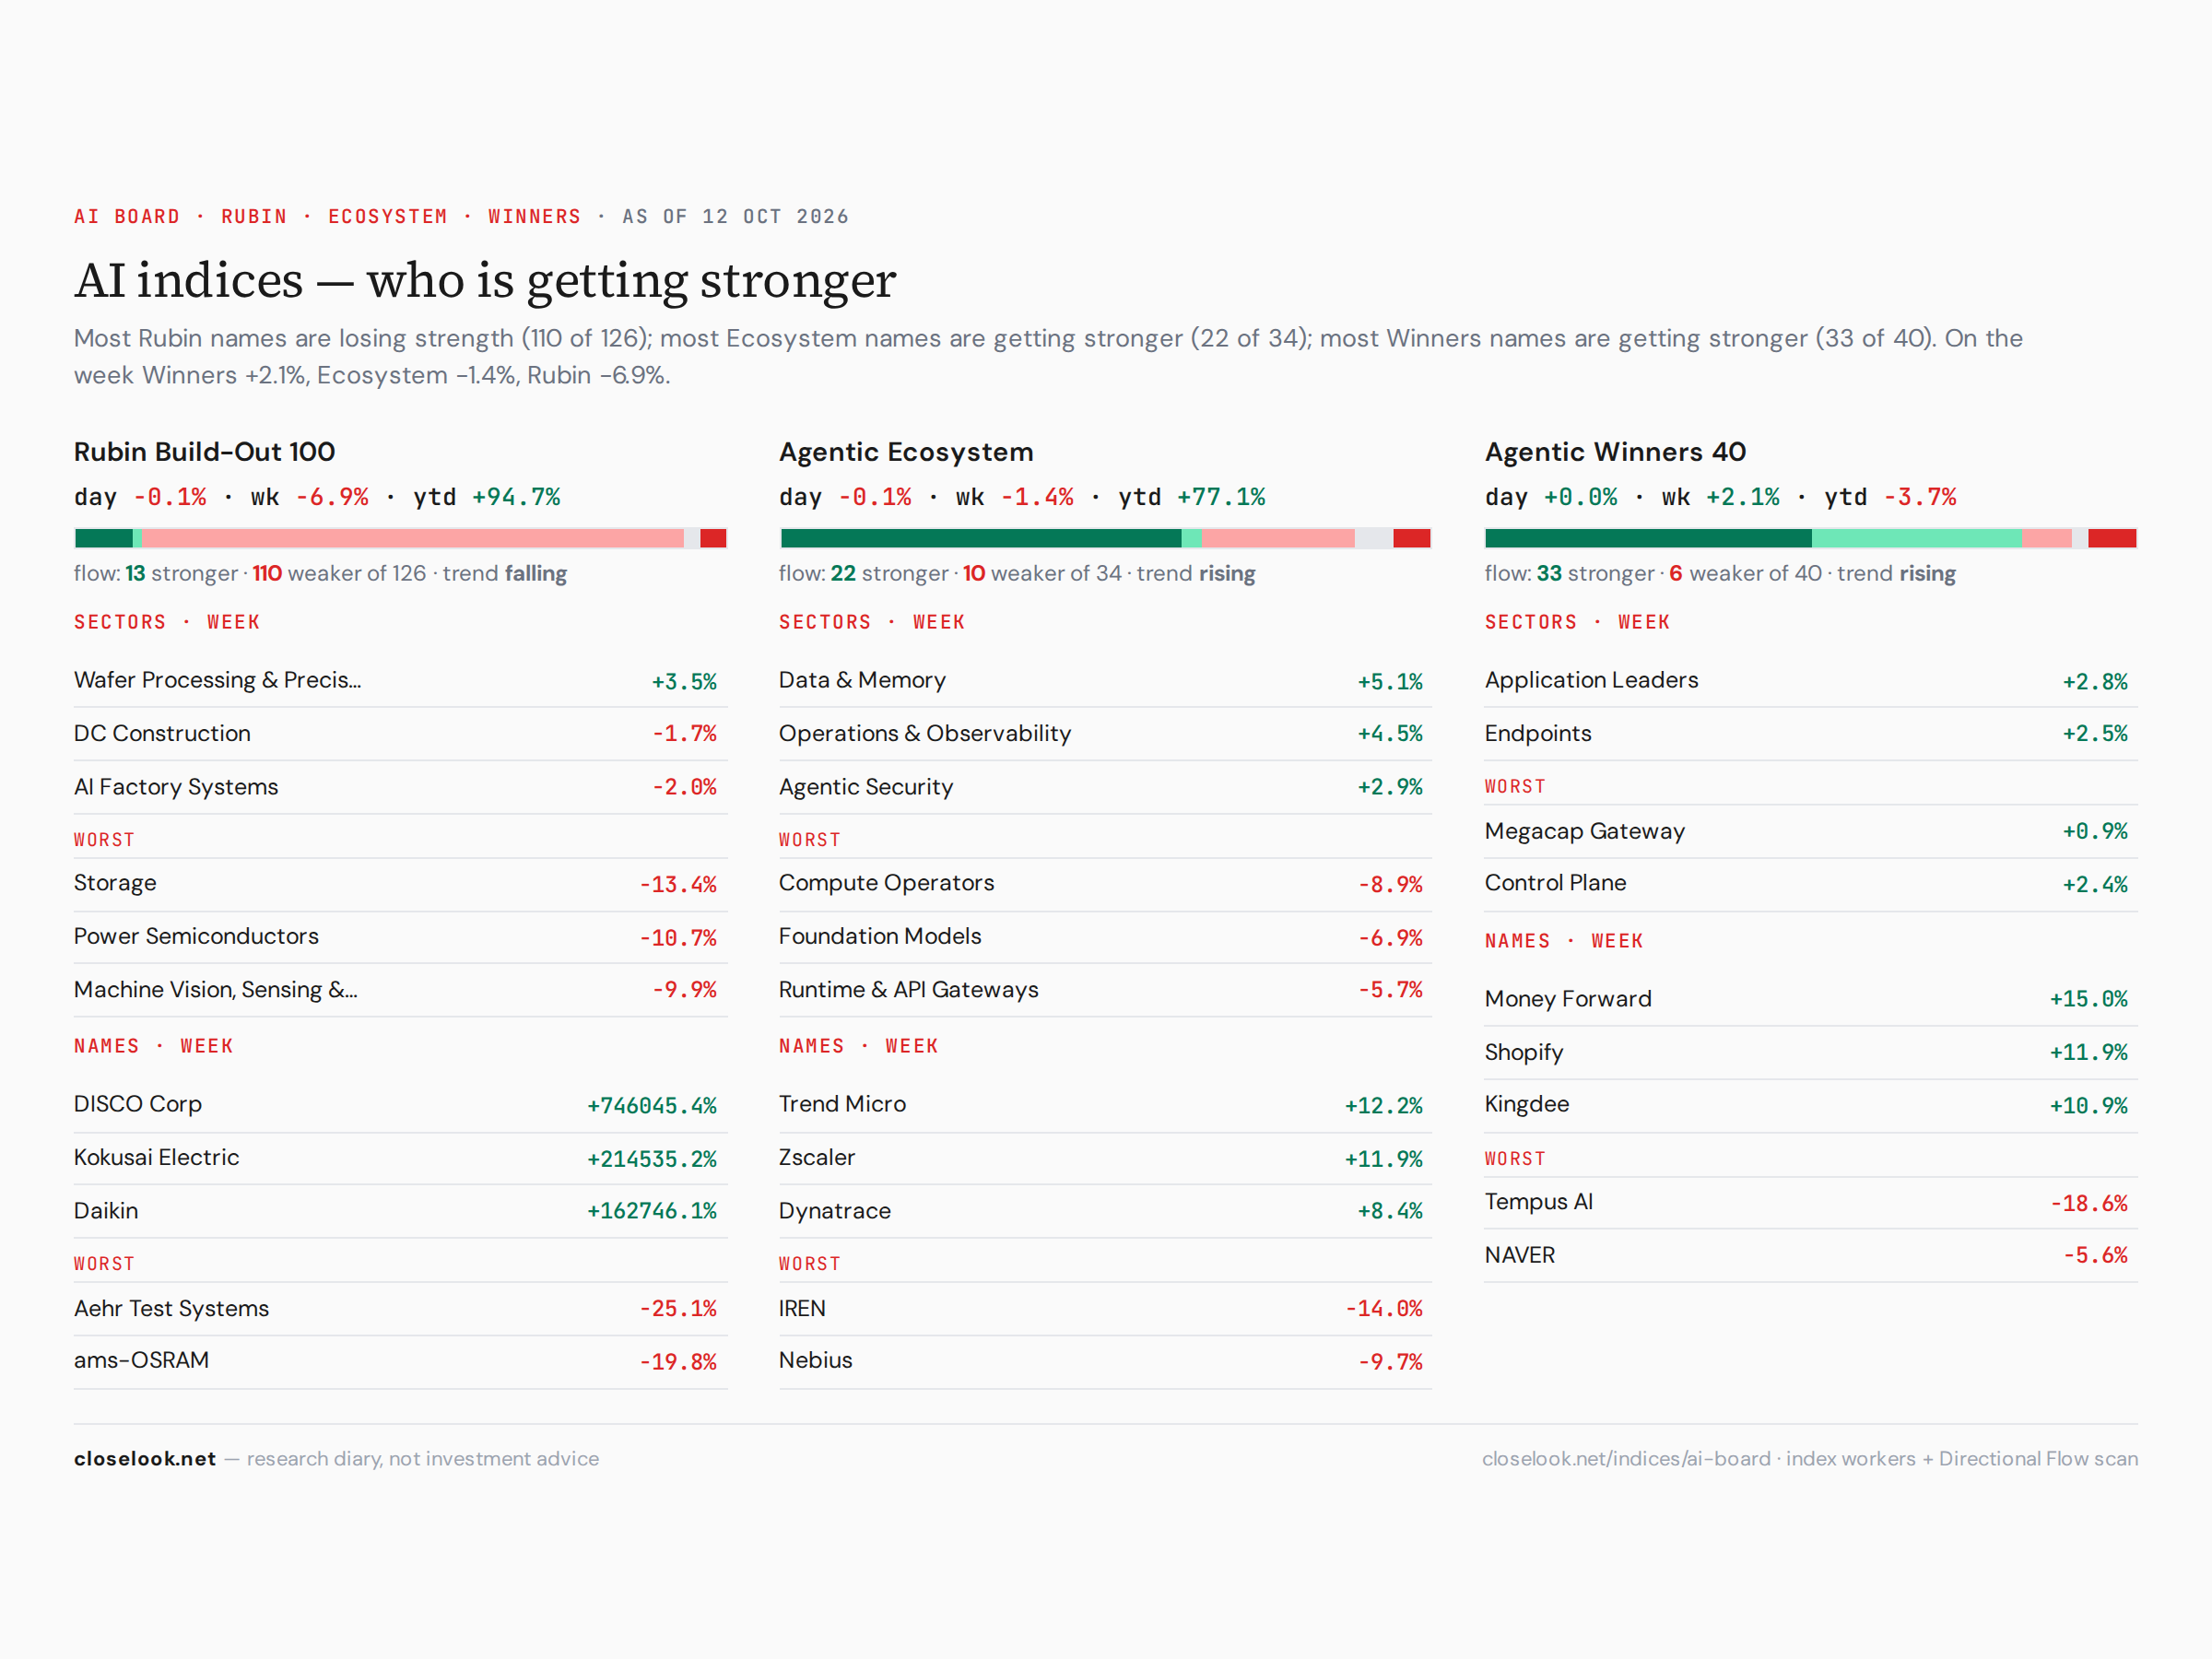
AI indices — Most Rubin names are losing strength (110 of 126); most Ecosystem names are getting stronger (22 of 34); most Winners names are getting stronger (33 of 40). On the week Winners +2.1%, Ecosystem −1.4%, Rubin −6.9%.
1 · The indices
| Index | Level | Day | Week | Month | YTD | From the year's high |
|---|---|---|---|---|---|---|
| Rubin Build-Out 100capex: what gets built | 2004.97 | −0.1% | −6.9% | +8.9% | +94.7% | −16.2%high 22 Jun 2026 |
| Agentic Ecosystemopex: what it costs to run | 1747.63 | −0.1% | −1.4% | +9.4% | +77.1% | −2.2%high 9 Oct 2026 |
| Agentic Winners 40applications: what gets sold on top | 942.23 | +0.0% | +2.1% | −0.4% | −3.7% | −6.6%high 7 Jan 2026 |
| Jensen — NVIDIA Strategic Authoritythe NVIDIA-ecosystem book | $3.39m | −3.1% | −5.8% | — | +142%since 12 Jul 2023 | — |
Equal-weight headline of each index. Jensen is a book, not an index: its value is the book's market value and its return runs since inception (so no YTD); day and week weight each live stock line's lake return by its market value, with the cash share at zero.
2 · Sectors: best and worst per index
Rubin 24 sectors
Week
Best 3
- Wafer Processing & Precision+3.5%
- DC Construction−1.7%
- AI Factory Systems−2.0%
Worst 3
- Storage−13.4%
- Power Semiconductors−10.7%
- Machine Vision, Sensing & Edge−9.9%
Year to date
Best 3
- Storage+288.3%
- Substrates & Interposers+248.2%
- HBM Memory+167.9%
Worst 3
- Photomasks & Mask Infrastructure+7.0%
- Robotics & Automation+14.8%
- Wafer Processing & Precision+21.3%
Ecosystem 8 sectors · Coordination & Messaging has no listed members yet
Week
Best 3
- Data & Memory+5.1%
- Operations & Observability+4.5%
- Agentic Security+2.9%
Worst 3
- Compute Operators−8.9%
- Foundation Models−6.9%
- Runtime & API Gateways−5.7%
Year to date
Best 3
- Foundation Models+367.0%
- Runtime & API Gateways+171.9%
- Operations & Observability+85.9%
Worst 3
- Compute Operators+44.4%
- Data & Memory+56.6%
- Identity, Trust & Governance+74.7%
Winners 4 sectors
Week
Best 2
- Application Leaders+2.8%
- Endpoints+2.5%
Worst 2
- Megacap Gateway+0.9%
- Control Plane+2.4%
Year to date
Best 2
- Megacap Gateway+18.3%
- Application Leaders−2.3%
Worst 2
- Endpoints−18.0%
- Control Plane−6.5%
3 · Top and bottom ten sectors across all three
36 sector sub-indices of Rubin, Ecosystem and Winners in one ranking, equal weight.
Week
Top ten
- Data & MemoryEcosystem+5.1%
- Operations & ObservabilityEcosystem+4.5%
- Wafer Processing & PrecisionRubin+3.5%
- Agentic SecurityEcosystem+2.9%
- Application LeadersWinners+2.8%
- EndpointsWinners+2.5%
- Control PlaneWinners+2.4%
- Megacap GatewayWinners+0.9%
- Identity, Trust & GovernanceEcosystem+0.3%
- DC ConstructionRubin−1.7%
Bottom ten
- StorageRubin−13.4%
- Power SemiconductorsRubin−10.7%
- Machine Vision, Sensing & EdgeRubin−9.9%
- Advanced Packaging & BondingRubin−9.4%
- HBM MemoryRubin−8.9%
- Compute OperatorsEcosystem−8.9%
- Substrates & InterposersRubin−7.8%
- Testing & MetrologyRubin−7.5%
- Foundation ModelsEcosystem−6.9%
- Foundry & IntegrationRubin−6.9%
Year to date
Top ten
- Foundation ModelsEcosystem+367.0%
- StorageRubin+288.3%
- Substrates & InterposersRubin+248.2%
- Runtime & API GatewaysEcosystem+171.9%
- HBM MemoryRubin+167.9%
- Advanced MaterialsRubin+140.5%
- AI Factory SystemsRubin+138.4%
- High-Speed InterconnectsRubin+107.7%
- Testing & MetrologyRubin+97.4%
- Advanced Packaging & BondingRubin+94.4%
Bottom ten
- EndpointsWinners−18.0%
- Control PlaneWinners−6.5%
- Application LeadersWinners−2.3%
- Photomasks & Mask InfrastructureRubin+7.0%
- Robotics & AutomationRubin+14.8%
- Megacap GatewayWinners+18.3%
- Wafer Processing & PrecisionRubin+21.3%
- Gases, Chemicals & ConsumablesRubin+30.5%
- LithographyRubin+35.5%
- Grid & Power InfrastructureRubin+40.9%
4 · Top and bottom ten names across all three
202 names in Rubin, Ecosystem and Winners together, each counted once.
Week
Top ten
| DISCO Corp6146.TRubin · Wafer Processing & Precision | +746045.4% |
|---|---|
| Kokusai Electric6525.TRubin · Deposition, Etch & Process | +214535.2% |
| Daikin6367.TRubin · Thermal Management | +162746.1% |
| Kioxia285A.TRubin · Storage | +146222.5% |
| Lasertec6920.TRubin · Testing & Metrology | +82983.8% |
| AGC Inc.5201.TRubin · Substrates & Interposers | +77768.4% |
| Horiba6856.TRubin · Fab Subsystems & Process Infra | +70540.9% |
| Ibiden4062.TRubin · Substrates & Interposers | +56016.0% |
| Hamamatsu Photonics6965.TRubin · Testing & Metrology | +30330.4% |
| Toppan Holdings7911.TRubin · Photomasks & Mask Infrastructure | +30110.6% |
Bottom ten
| Aehr Test SystemsAEHRRubin · Testing & Metrology | −25.1% |
|---|---|
| ams-OSRAMAMS.SWRubin · Machine Vision, Sensing & Edge | −19.8% |
| Tempus AITEMWinners · Application Leaders | −18.6% |
| Applied OptoelectronicsAAOIRubin · High-Speed Interconnects | −17.2% |
| Onto InnovationONTORubin · Testing & Metrology | −15.9% |
| ARM HoldingsARMRubin · EDA & Chip IP | −15.7% |
| VicorVICRRubin · Power Semiconductors | −15.1% |
| IRENIRENEcosystem · Compute Operators | −14.0% |
| CoherentCOHRRubin · High-Speed Interconnects | −13.7% |
| TeradyneTERRubin · Testing & Metrology | −13.7% |
Year to date
Top ten
| AT&SATS.VIRubin · Substrates & Interposers | +555.5% |
|---|---|
| SoitecSOI.PARubin · Advanced Materials | +521.2% |
| Unimicron3037.TWRubin · Substrates & Interposers | +473.1% |
| SanDiskSNDKRubin · Storage | +440.4% |
| Zhipu AI / Z.ai2513.HKEcosystem · Foundation Models | +370.7% |
| Kioxia285A.TRubin · Storage | +362.7% |
| Dell TechnologiesDELLRubin · AI Factory Systems | +354.7% |
| Furukawa Electric5801.TRubin · High-Speed Interconnects | +288.6% |
| Aehr Test SystemsAEHRRubin · Testing & Metrology | +252.8% |
| Lenovo Group0992.HKRubin · AI Factory Systems | +238.6% |
Bottom ten
| AppLovinAPPWinners · Endpoints | −56.2% |
|---|---|
| CoStarCSGPWinners · Application Leaders | −55.5% |
| IntuitINTUWinners · Application Leaders | −51.1% |
| Kingdee0268.HKWinners · Application Leaders | −42.7% |
| HubSpotHUBSWinners · Application Leaders | −41.6% |
| monday.comMNDYWinners · Application Leaders | −40.9% |
| RedditRDDTWinners · Endpoints | −33.9% |
| AdobeADBEWinners · Application Leaders | −28.5% |
| OracleORCLWinners · Control Plane | −27.3% |
| Sea LimitedSEWinners · Endpoints | −27.1% |
5 · Best and worst names per index
Rubin 130 names
Week
Best 5
- DISCO Corp+746045.4%
- Kokusai Electric+214535.2%
- Daikin+162746.1%
- Kioxia+146222.5%
- Lasertec+82983.8%
Worst 5
- Aehr Test Systems−25.1%
- ams-OSRAM−19.8%
- Applied Optoelectronics−17.2%
- Onto Innovation−15.9%
- ARM Holdings−15.7%
Year to date
Best 5
Worst 5
- Photronics−12.5%
- Fabrinet−4.8%
- Yaskawa Electric−3.6%
- Nova Ltd−2.0%
- Canon−0.5%
Ecosystem 34 names
Week
Best 5
- Trend Micro+12.2%
- Zscaler+11.9%
- Dynatrace+8.4%
- Everpure+7.9%
- NetApp+6.9%
Worst 5
- IREN−14.0%
- Nebius−9.7%
- CoreWeave−8.2%
- BlackBerry−6.9%
- Zhipu AI / Z.ai−6.9%
Year to date
Best 5
- Zhipu AI / Z.ai+370.7%
- Okta+171.5%
- DigitalOcean+168.3%
- Fastly+159.4%
- Fortinet+147.7%
Worst 5
- IREN−18.5%
- Kingsoft Cloud−15.4%
- MongoDB−4.6%
- CoreWeave+1.2%
- Zscaler+2.4%
6 · The structure underneath: Directional Flow
Directional Flow is the Pattern Scanner's trend-persistence reading for each member. "Stronger" counts names whose flow is accelerating up or has turned up; "weaker" counts names whose flow is decelerating or accelerating down. The trend compares the five-day change of the average flow with its 21-day change.
Rubin 126 names
- getting stronger 11
- turning up 2
- losing force 105
- flat 3
- getting weaker 5
- Stronger / weaker
- 13 / 110vs yesterday +1 / ±0
- Average flow
- 67.55 days −3.3 · 21 days −17.3 · vs — −3.1
- Trend
- falling
Turned since the prior session
- ↑ Synopsys flat → turning up
Strongest and weakest flow
- AT&S 230
- Dell Technologies 220
- Kioxia 212
- Photronics -29
- Fabrinet -27
- Nova Ltd -15
Ecosystem 34 names
- getting stronger 21
- turning up 1
- losing force 8
- flat 2
- getting weaker 2
- Stronger / weaker
- 22 / 10vs yesterday ±0 / +1
- Average flow
- 64.35 days +2.3 · 21 days +9.2 · vs — +2.2
- Trend
- rising
Turned since the prior session
- ↓ CoreWeave flat → getting weaker
Strongest and weakest flow
- BlackBerry 134
- Okta 132
- Palo Alto Networks 128
- Kingsoft Cloud -47
- IREN -18
- CoreWeave -7
Winners 40 names
- getting stronger 20
- turning up 13
- losing force 3
- flat 1
- getting weaker 3
- Stronger / weaker
- 33 / 6vs yesterday ±0 / +1
- Average flow
- -1.35 days +3.9 · 21 days +16.9 · vs — +3.8
- Trend
- rising
Turned since the prior session
- ↓ NAVER flat → getting weaker
Strongest and weakest flow
- Atlassian 81
- Money Forward 68
- ServiceNow 49
- CoStar -98
- Intuit -82
- AppLovin -81
More on the method: Directional Flow rankings · Rubin Rotation Radar · compare the indices. An investment research diary, not investment advice.
FAQ · from the current data · as of 2026-10-12
Quick answers
What is the AI Board?
A daily read of the three Closelooknet AI indices — Rubin Build-Out 100 (what gets built), the Agentic Ecosystem (what it costs to run) and Agentic Winners 40 (what gets sold on top) — plus the Jensen book: index level, sectors, names and the Directional Flow structure underneath. Closes through 12 Oct 2026.
When is it updated?
Tuesday to Saturday around 02:00 UTC, after the index workers and the Directional Flow scan have the prior US close. Saturday carries Friday.
What does "getting stronger" and "losing strength" mean here?
They count Directional Flow states. Getting stronger = the flow is accelerating up or has turned up; losing strength = the flow is still positive but decelerating, or accelerating down. Directional Flow is Closelooknet's trend-persistence reading from the Pattern Scanner, not a price return.
Which YTD base does the board use?
The index workers' base: the first close of the year (2 Jan 2026 this year). Member YTD is computed from lake closes on the same base, in local currency.
Is this investment advice?
No. The board is a data surface in an investment research diary; it records what the indices and their members did and recommends nothing.